Bitcoin (BTC) bounced off its firm support, and the bulls are trying to push the price above the psychologically crucial level of $70,000. Several analysts believe the consolidation will resolve to the upside, and Bitcoin will rise to a new all-time high.
Veteran trader Peter Brandt said in a report that Bitcoin's halving date historically falls in the middle of the bull cycle. In 2020, the bull market started 16 months before the halving and topped out 18 months after the event. If Bitcoin follows a similar pattern, Brandt expects the cycle top to be “in the $130,000 to $150,000 range.”
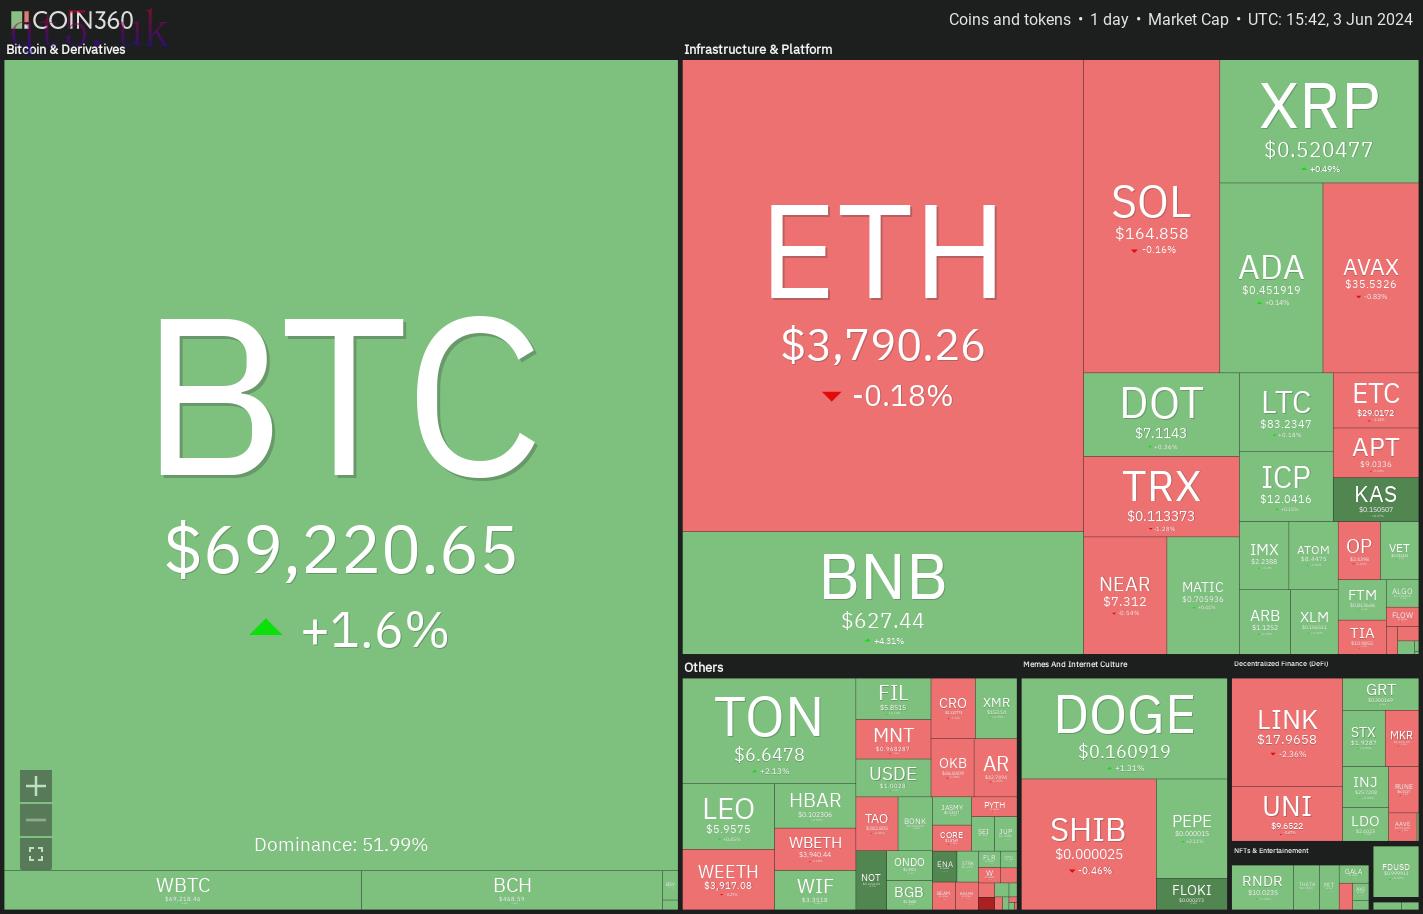 Daily cryptocurrency market performance. Source: Coin360
Not only Bitcoin but even Ether (ETH) could surprise to the upside. According to CryptoQuant data, traders have withdrawn nearly 797,000 Ether between May 23 and June 2. Analysts expect Ether to witness a supply squeeze and hit a new all-time high after Ether exchange-traded funds start trading.
Could Bitcoin and select altcoins overcome their respective overhead resistance levels? Let’s analyze the charts to find out.
S&P 500 Index price analysis
The S&P 500 Index (SPX) fell below the breakout level of 5,265 on May 30 and reached the 50-day simple moving average (5,181) on May 31.
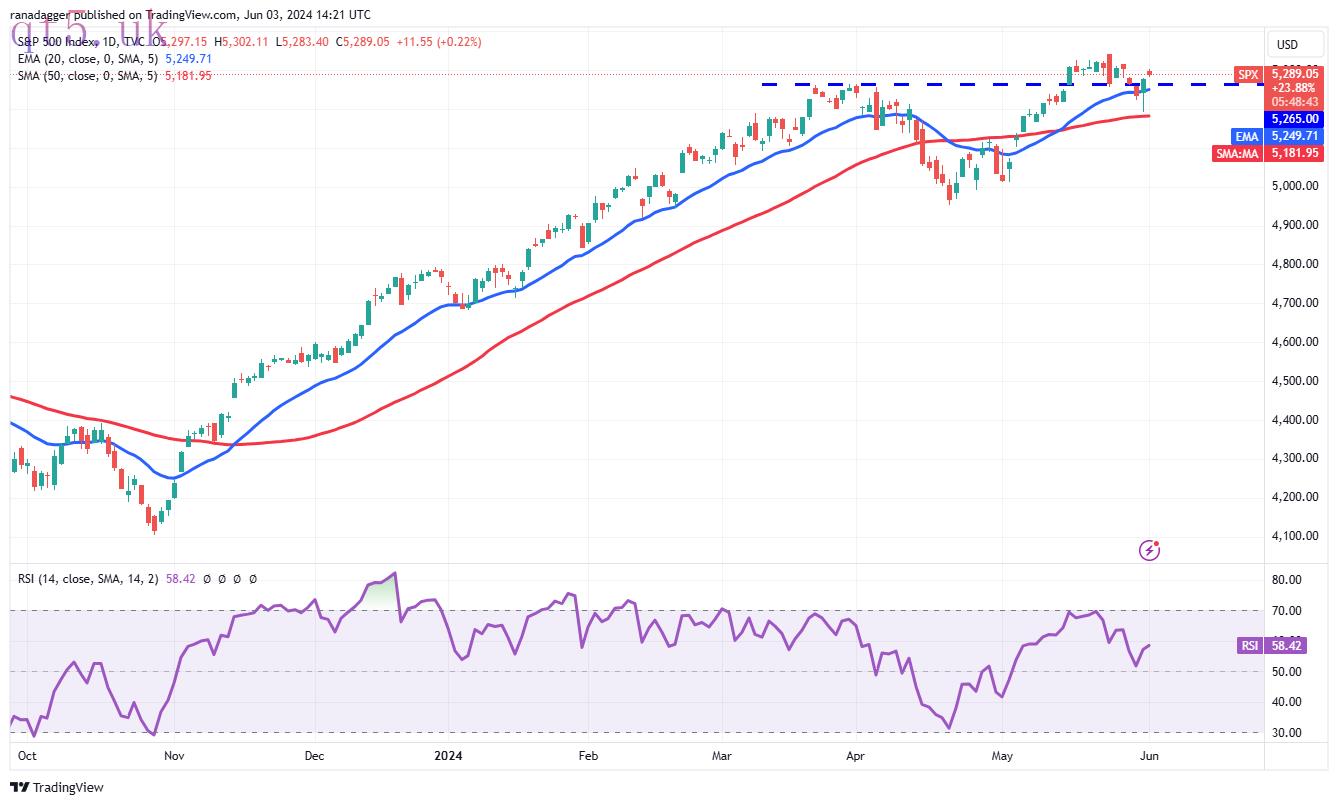 SPX daily chart. Source: TradingView
The solid rebound off the 50-day SMA suggests that the sentiment remains positive, and traders are viewing the dips as a buying opportunity. However, the bears are unlikely to give up easily. They will attempt to stall the relief rally in the 5,265 to 5,342 zone.
If the price turns down from the overhead zone and breaks below the 50-day SMA, it will signal the start of a deeper correction toward 5,000. On the other hand, if buyers shove the price above 5,342, the index could reach 5,500.
U.S. Dollar Index price analysis
The U.S. Dollar Index (DXY) turned down from the 50-day SMA (105) on May 30 and slipped below the support line of the ascending channel on June 3.
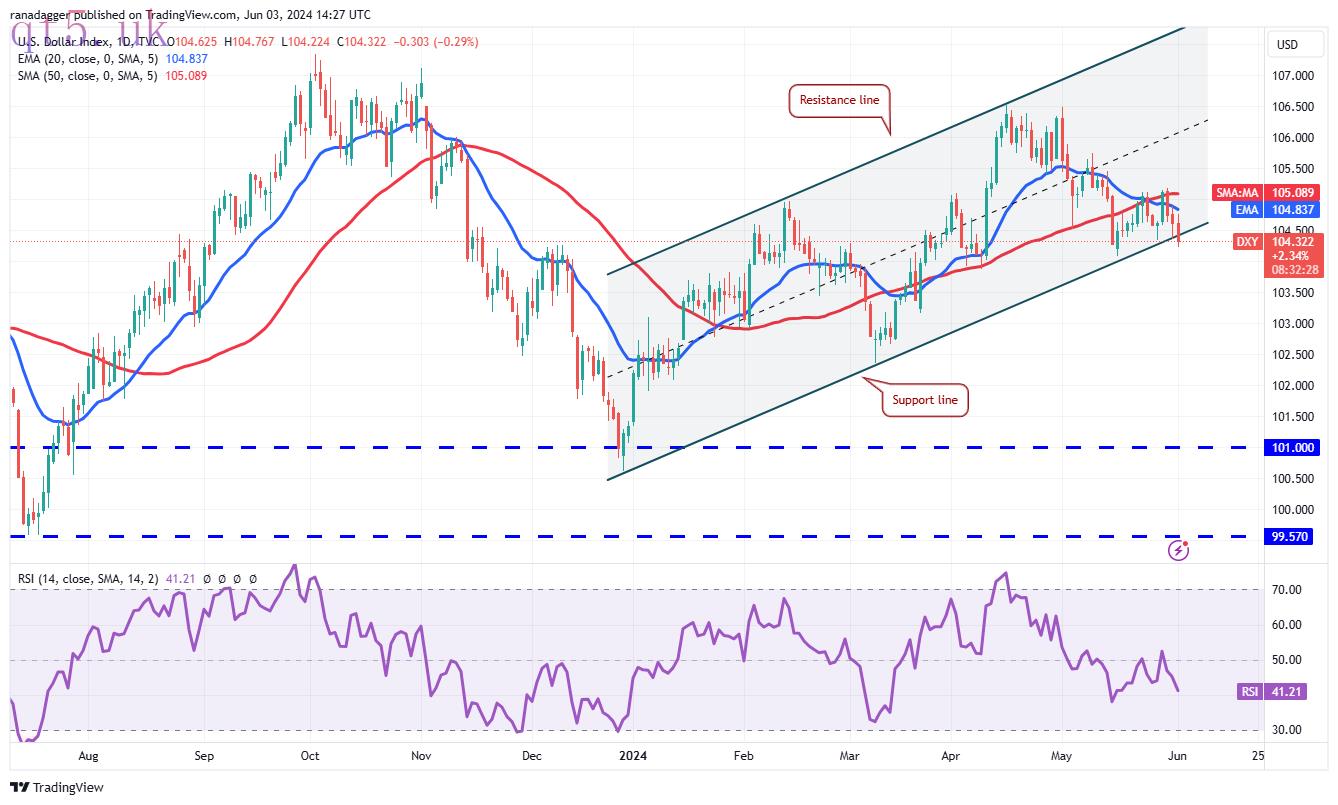 DXY daily chart. Source: TradingView
The downsloping 20-day exponential moving average (105) and the relative strength index (RSI) in the negative zone give the bears a slight edge. If the price sustains below the channel, the index could decline to 103.17 and later to 102.35.
On the contrary, if the price rises and breaks above the 50-day SMA, it will suggest that the breakdown was a bear trap. That could result in short covering, pushing the index to 105.75 and subsequently to 106.50.
Bitcoin price analysis
The bears failed to sink and maintain Bitcoin below the support line of the triangle even after several attempts. That may have attracted buying by the bulls.
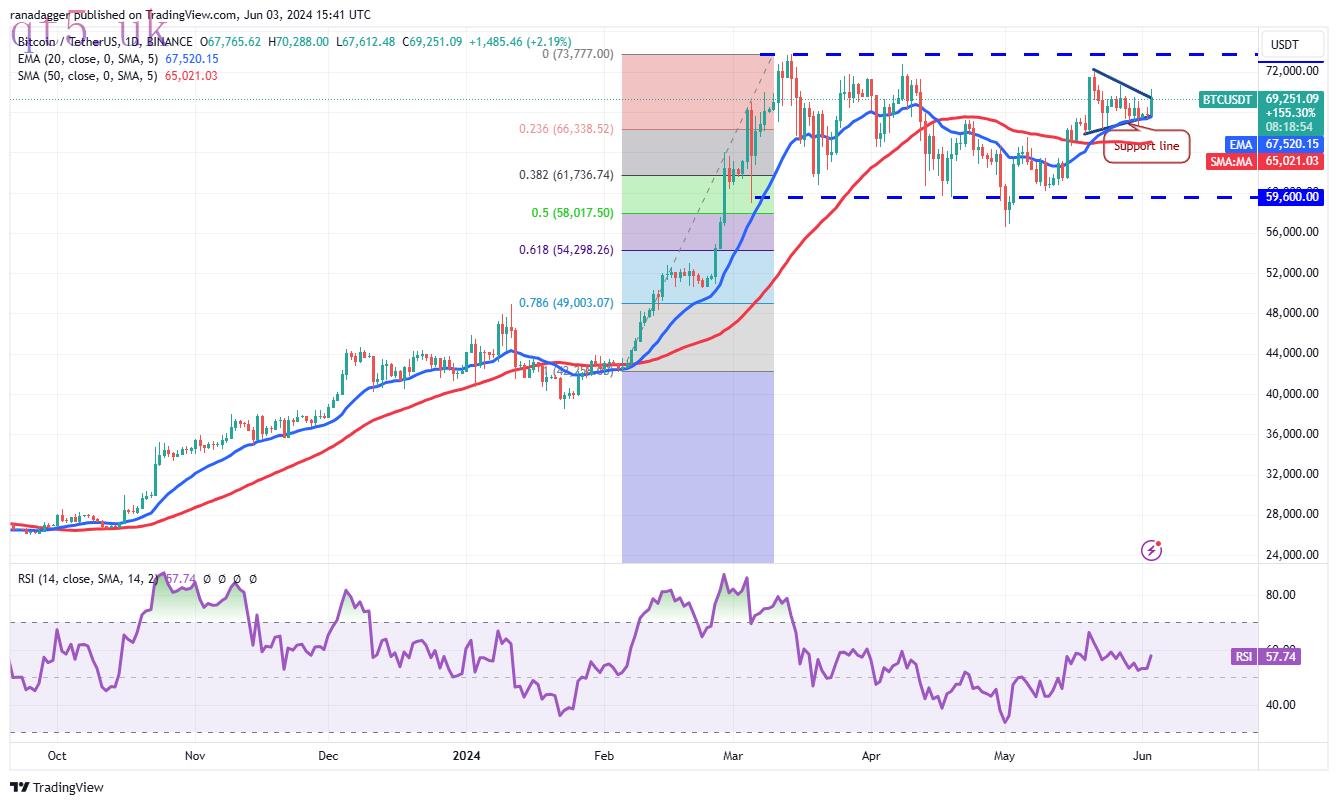 BTC/USDT daily chart. Source: TradingView
A break and close above the triangle will suggest that the uncertainty has resolved in favor of the bulls. The BTC/USDT pair could then attempt a rally to the strong overhead resistance at $73,777. If bulls pierce this level, the pair could skyrocket to $80,000.
Time is running out for the bears. If they want to remain in the game, they will have to quickly drag the price below the triangle’s support line. That will open the gates for a possible drop to the critical support at $59,600.
Ether price analysis
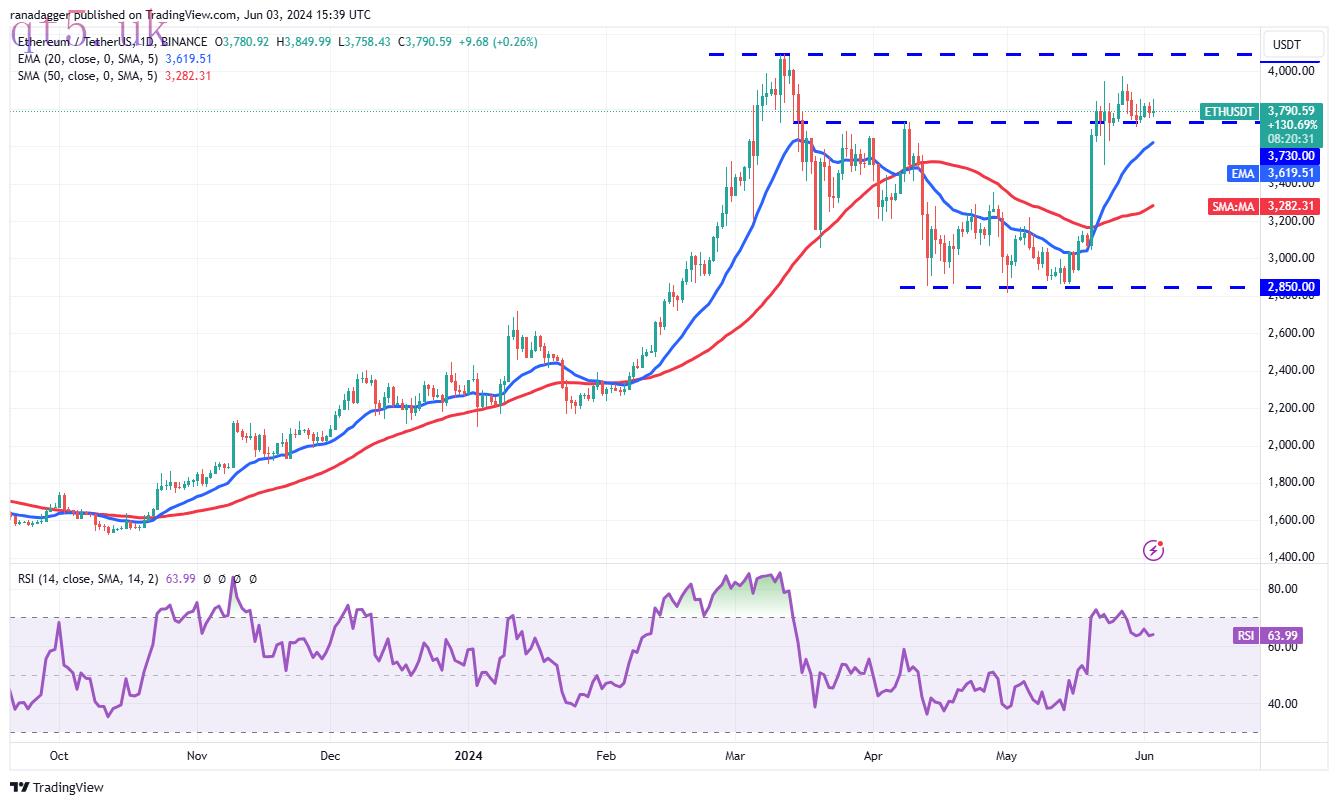
Ether has been holding above $3,730 for several days, signaling that the bulls are trying to flip the level into support.
 ETH/USDT daily chart. Source: TradingView
The upsloping 20-day EMA ($3,619) and the RSI in the positive zone suggest that the bulls have the upper hand. Buyers will try to clear the minor obstacle at $3,977 and challenge the overhead resistance of $4,100.
Conversely, if the price turns down and breaks below $3,730, it will suggest that the bears are trying to make a comeback. The selling could pick up after bears sink the price below the 20-day EMA. The ETH/USDT pair may then slump to the 50-day SMA ($3,282).
BNB price analysis
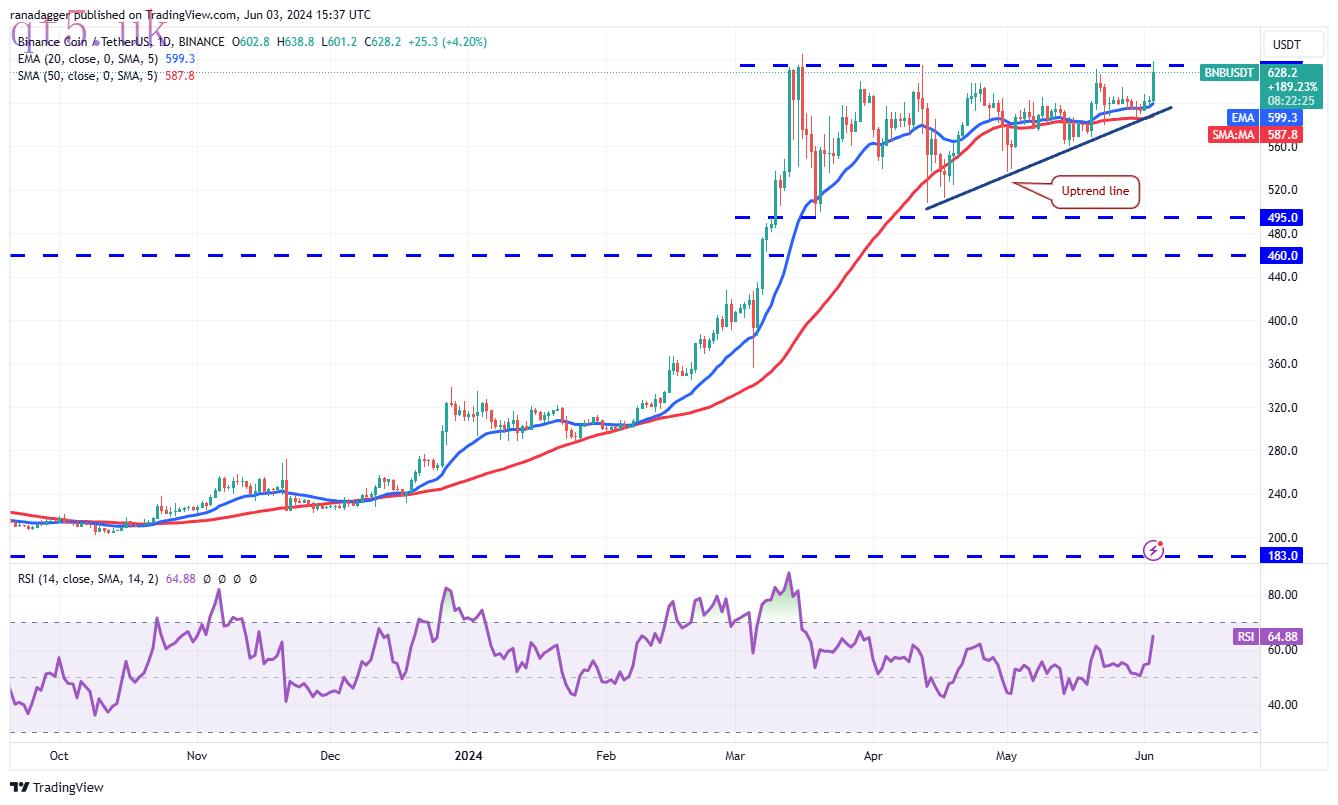
After trading in a small range for several days, BNB (BNB) rose sharply on June 3, signaling that the bulls are attempting to seize control.
 BNB/USDT daily chart. Source: TradingView
A break and close above the $635 resistance will complete the bullish ascending triangle pattern. That could start the next leg of the uptrend to $692. This level is expected to behave as a significant barrier, but if crossed, the BNB/USDT pair may soar to the pattern target of $775.
This bullish view will be invalidated in the near term if the price turns down sharply from the overhead resistance and plunges below the uptrend line. Such a move will invalidate the bullish setup and pull the price to $536.
Solana price analysis
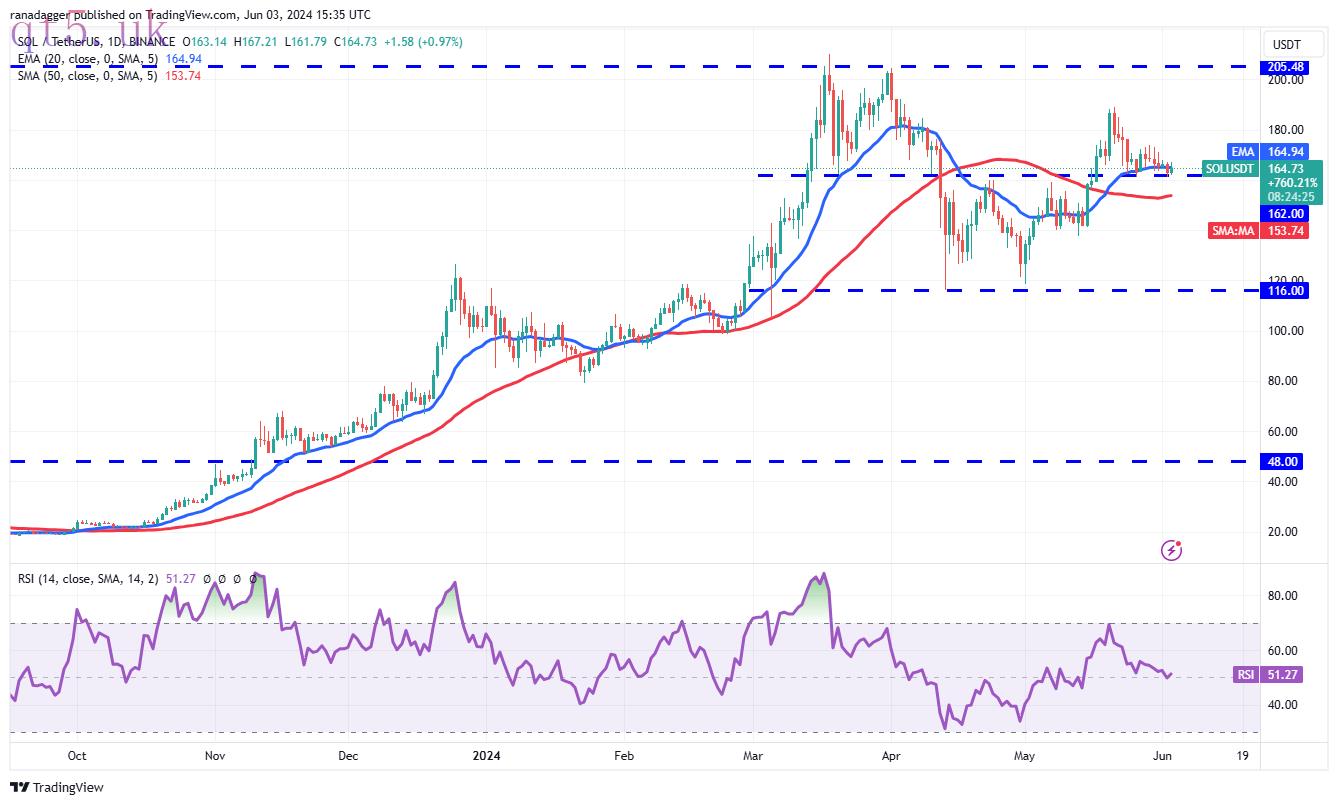
Solana (SOL) is witnessing a tough battle between the bulls and the bears near the breakout level of $162.
 SOL/USDT daily chart. Source: TradingView
If the bears prevail and sink the price below $162, the SOL/USDT pair could drop to the 50-day SMA ($153). This level may act as a minor support but is likely to be broken. The pair may then slide to $140.
If bulls want to prevent the downside, they will have to quickly push the price above $174. If they do that, the pair could rally to $189 and thereafter to $205. The bulls may find it difficult to conquer the $205 resistance.
XRP price analysis
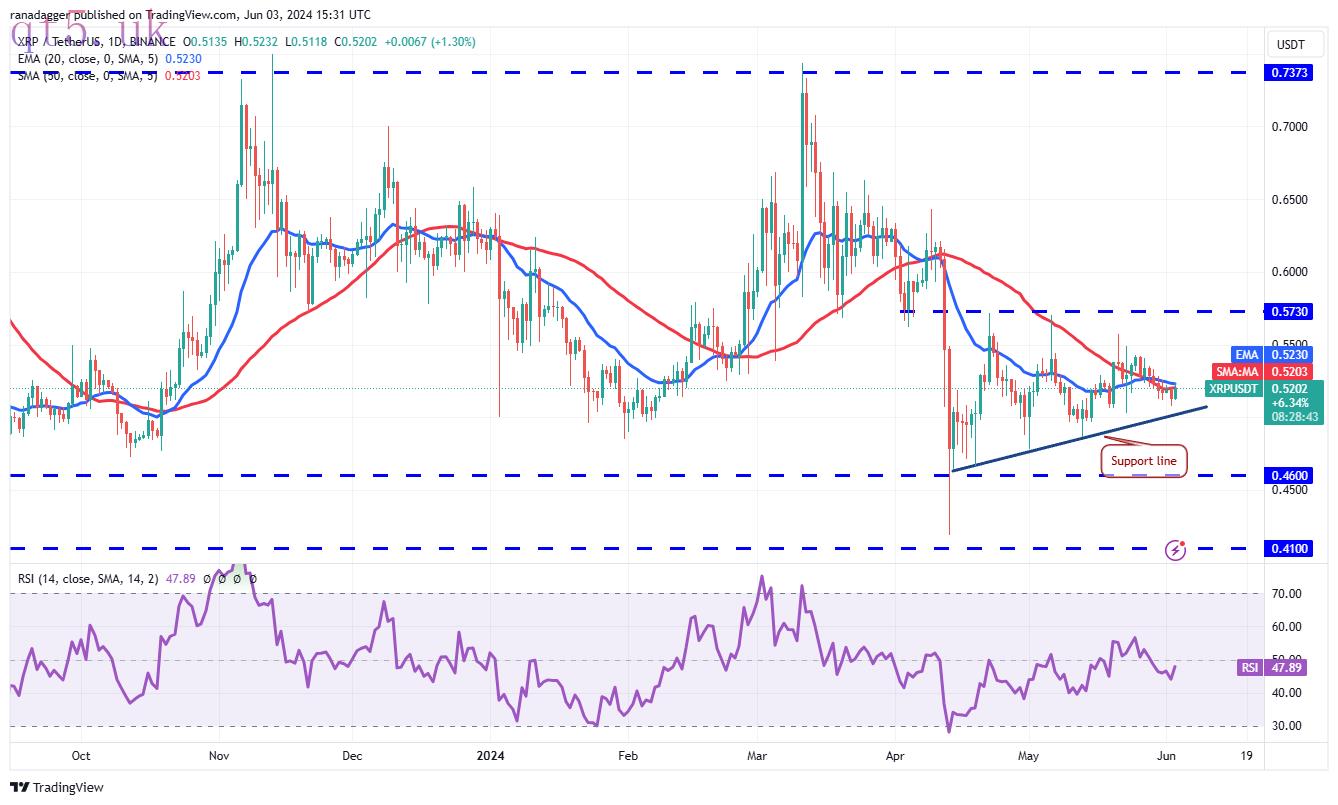
XRP (XRP) has been trading below the 20-day EMA ($0.52) for the past few days, but the bears have failed to sink the price below the support line. This suggests that selling dries up at lower levels.
 XRP/USDT daily chart. Source: TradingView
The bulls will try to push the price above the moving averages. If they succeed, the XRP/USDT pair will attempt a rally to the overhead resistance of $0.57. Buyers will have to overcome this barrier to complete the ascending triangle pattern.
The key level to watch out for on the downside is the support line. If the level cracks, the pair could tumble to the critical support at $0.46. A strong rebound off the support could keep the pair inside the $0.46 to $0.57 range for some more time.
Related: Bitcoin battles key resistance as trader flags $100K BTC price 'magnet'
Toncoin price analysis
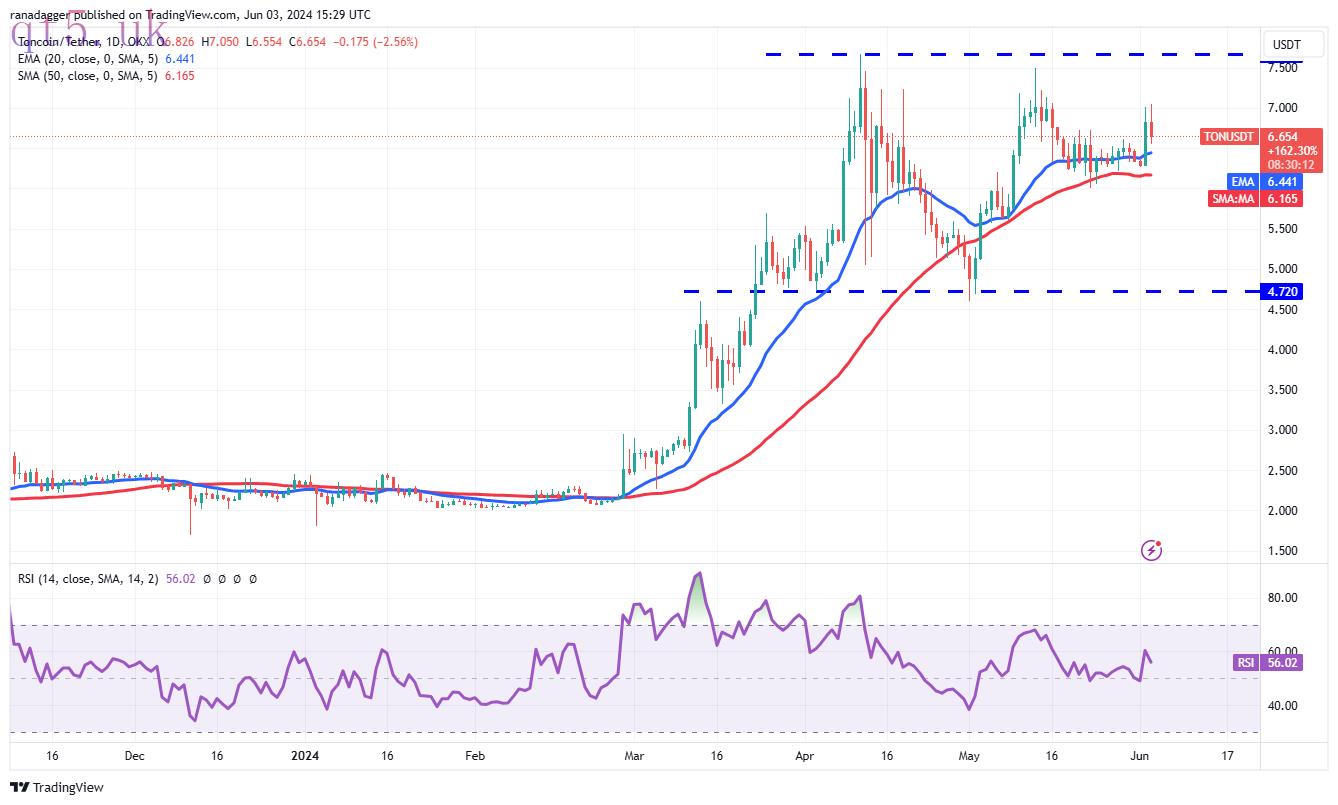
Toncoin (TON) rallied sharply on June 2 and broke above the immediate overhead resistance at $6.73, signaling a slight advantage to the bulls.
 TON/USDT daily chart. Source: TradingView
However, the buyers are struggling to sustain the higher levels. This suggests that the bears are selling in the zone between $7 and $7.67. If the price turns up from the current level or rebounds off the 20-day EMA ($6.43), it will suggest that the bulls are buying the dips. That will improve the prospects of a rally to $7.67.
This positive view will be invalidated in the near term if the price turns down and breaks below the 20-day EMA. The near-term trend will favor the bears if they can sink the TON/USDT pair below $6.
Dogecoin price analysis
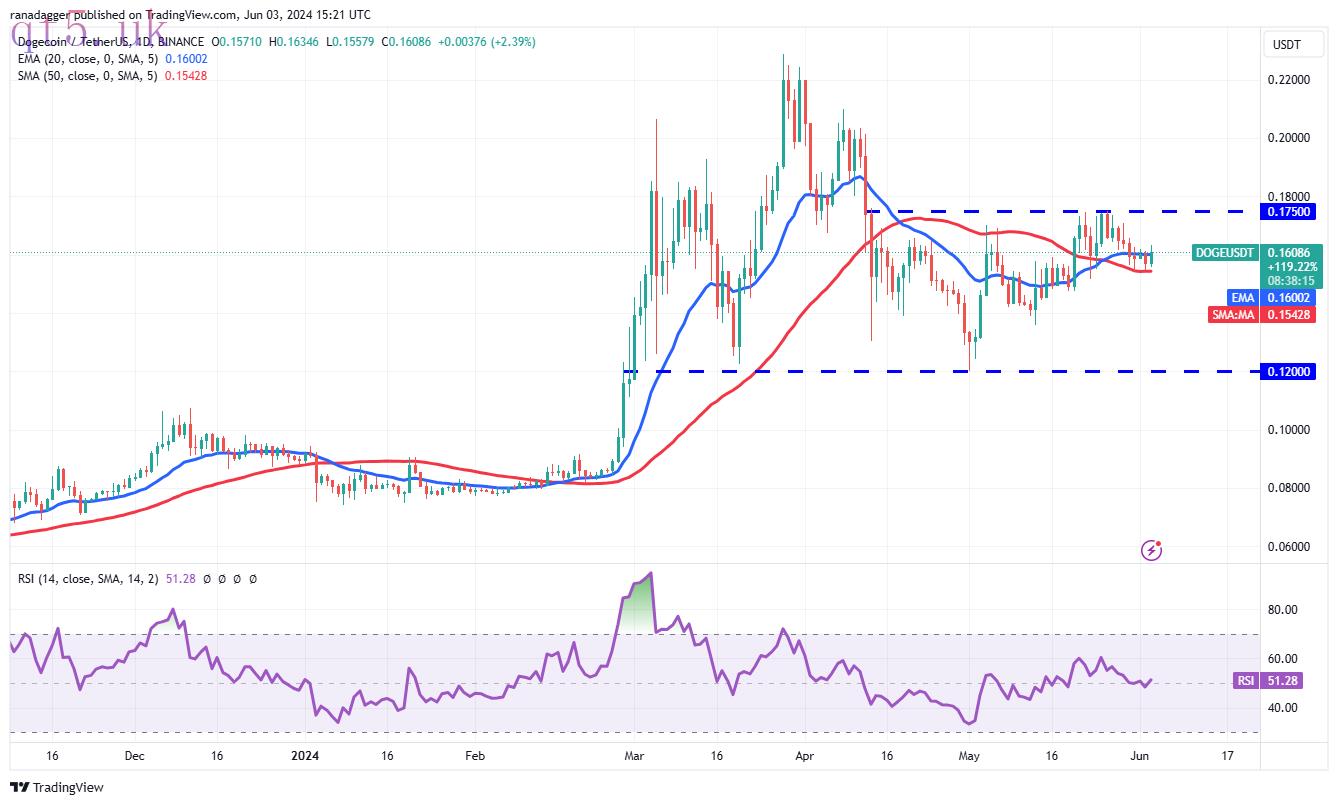
Dogecoin (DOGE) turned up from the 50-day SMA ($0.15), indicating that the bulls are fiercely defending the level.
 DOGE/USDT daily chart. Source: TradingView
The bulls will try to drive the price to the overhead resistance of $0.18. This is an important resistance to watch out for because a break and close above it will open the doors for a possible rally to $0.21.
Contrarily, if the price turns down from $0.18, it will signal that the bears are active at higher levels. That could keep the DOGE/USDT pair stuck between $0.18 and the 50-day SMA for a while. A break below the 50-day SMA will tilt the short-term advantage in favor of the bears. The pair may then dive toward $0.14.
Cardano price analysis
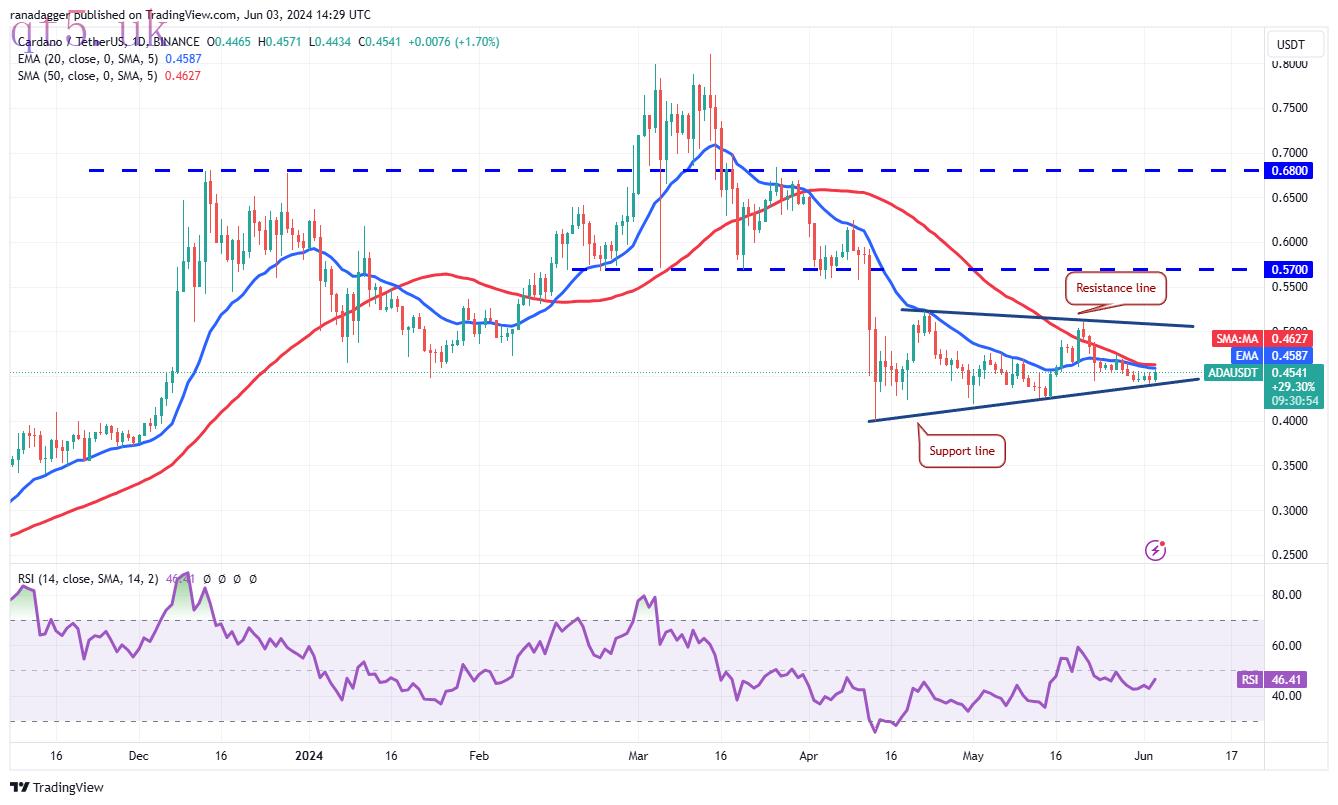
The bulls are attempting to defend the support line of the symmetrical triangle pattern in Cardano (ADA), signaling buying at lower levels.
 ADA/USDT daily chart. Source: TradingView
Buyers will have to drive the price above the moving averages to suggest that the ADA/USDT pair may extend its stay inside the triangle for some more time. The pair could then reach the resistance line where the bears are expected to mount a strong defense.
Alternatively, if the price turns down from the moving averages, it will signal that every minor rise is being sold into. That will enhance the prospects of a break below the triangle. The pair could descend to the strong support at $0.35.
This article does not contain investment advice or recommendations. Every investment and trading move involves risk, and readers should conduct their own research when making a decision.



 download
 download
 website