

Ether (ETH) began the second half of the year on a positive note, rising roughly 2.5% to trade at $3,469. The altcoin’s recovery mirrored similar upside moves elsewhere in the crypto market, with the net capitalization rising by approximately 2.3% to rest at $2.32 trillion.
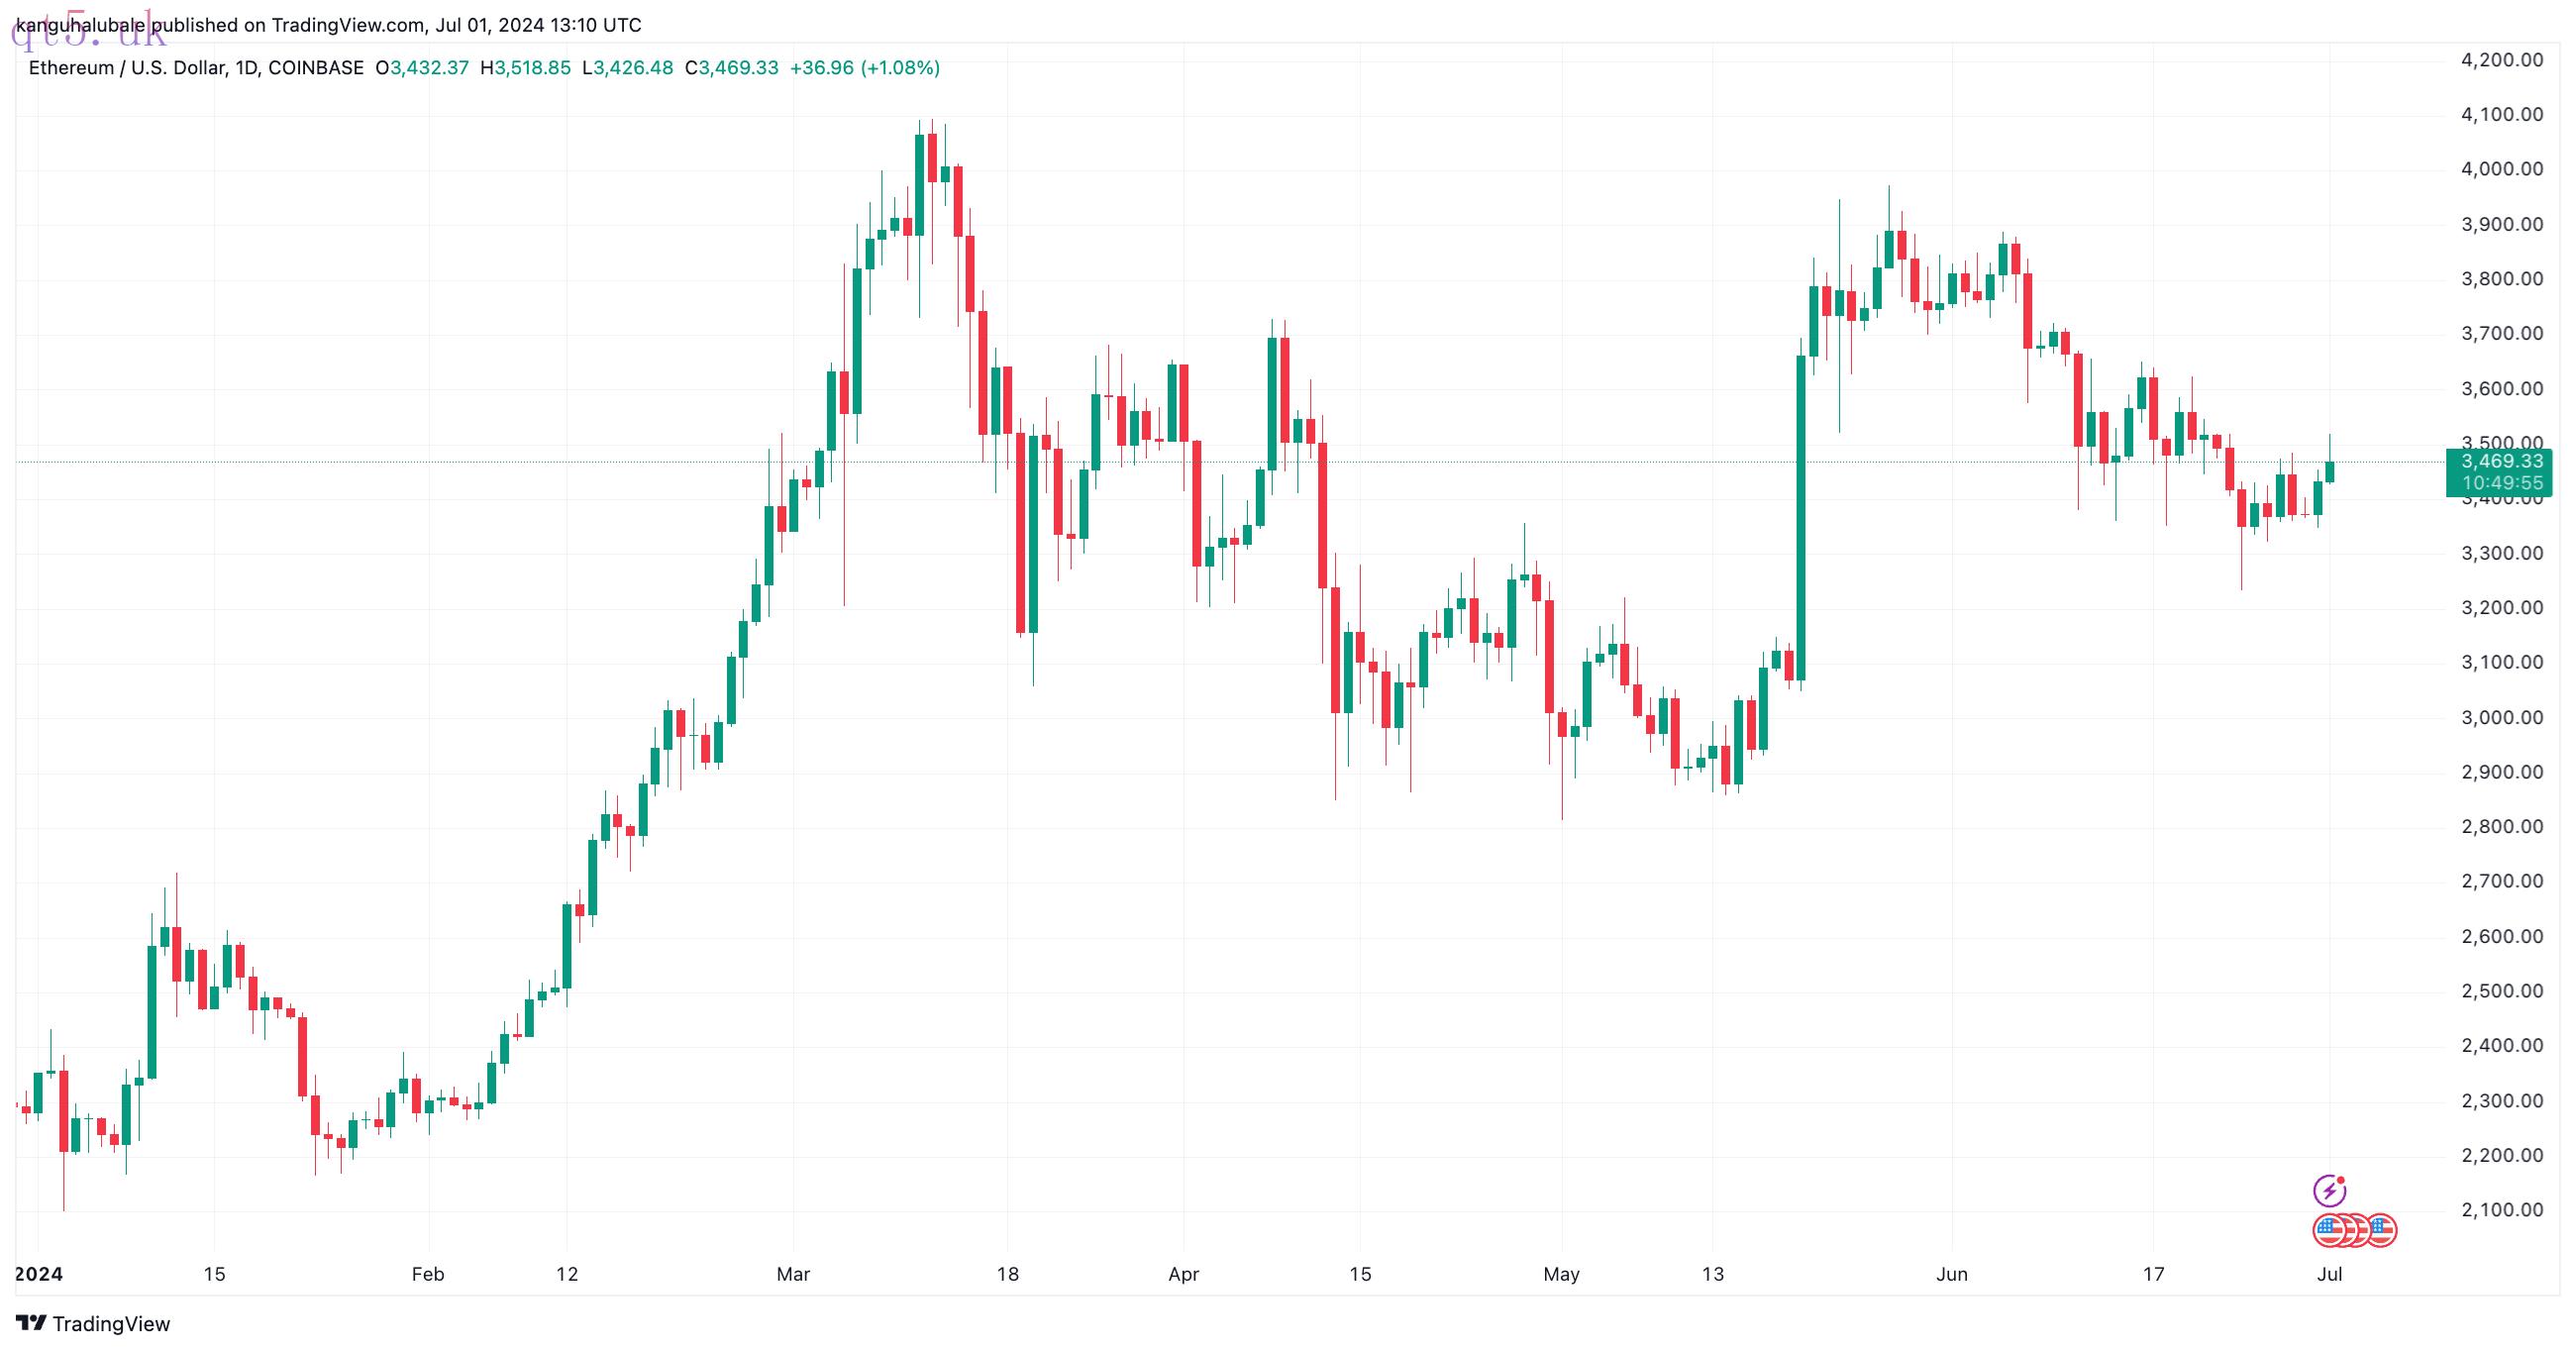 ETH/USD daily chart. Source: TradingView
The primary factors contributing to the rise in Ether’s price include the anticipated launch of spot Ethereum exchange-traded funds (ETFs) in the United States and bullish onchain metrics.
Let’s explore these influences in detail.
Spot Ethereum ETFs expected to boost Ether price
The rise in the price of ETH appears to be a buildup in momentum in the run-up to the launch of spot Ethereum ETFs in the United States. The launch, which was expected to occur as early as July 2, has been delayed by the U.S. Securities and Exchange Commission (SEC).
The SEC commented on the S-1 forms at the end of last week and requested resubmissions by July 8. According to Bloomberg Senior ETF analyst Eric Balchunas, this new timeline means the launch of the spot Ethereum ETFs could be postponed until mid-to-late July.
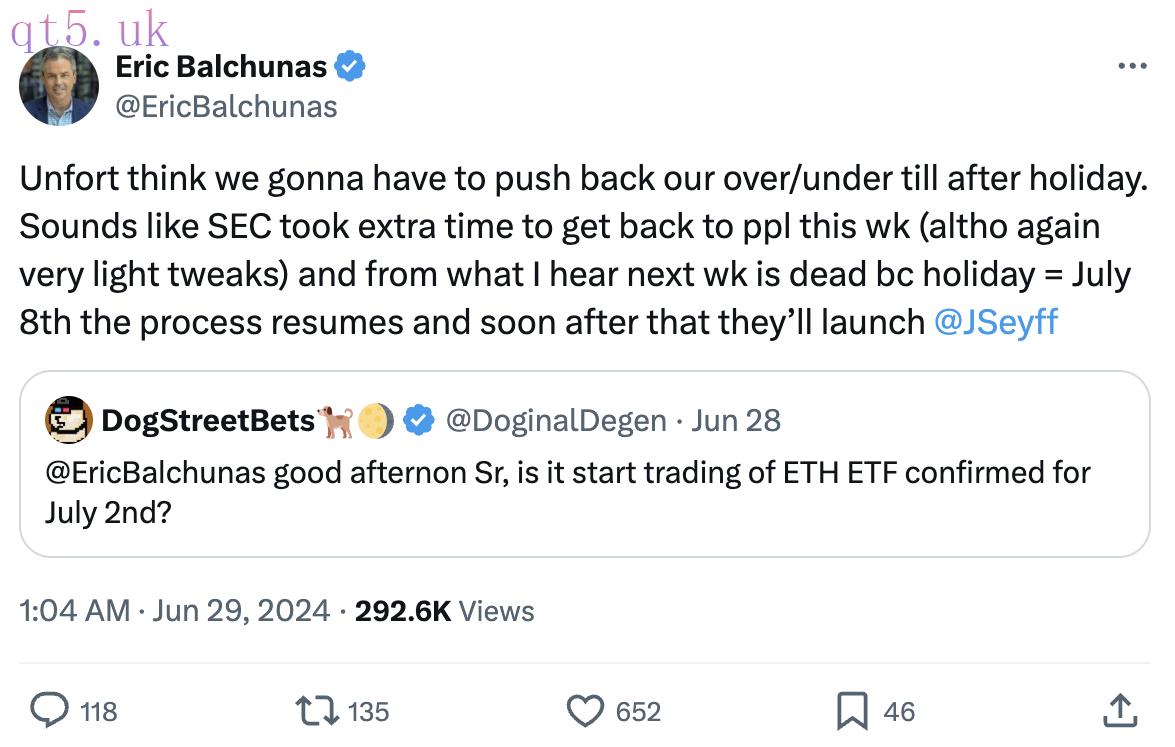 Source: Eric Balchunas
Although the exact timeline remains uncertain, the SEC has indicated a potential launch this summer.
Following the success of spot Bitcoin ETFS, the launch of spot Ethereum ETFs is expected to attract capital inflows that will likely push the ETH price higher.
An analyst at Steno Research projected net inflows of $15 to $20 billion into spot Ethereum ETFs in the first 12 months, which could push Ether’s price to $6,500 by the end of 2024.
In a report published on June 27, senior analyst Mads Eberhardt wrote,
“We continue to forecast a net inflow between $15 billion and $20 billion in the first 12 months, even considering the outflow from the Grayscale Ethereum Trust (ETHE).”Eberhardt added that this should drive the value of Ether higher, both against the dollar and against Bitcoin (BTC).
Ether balance on exchanges plunges to 4-year low
According to data resource CryptoQuant, the total amount of Ether held by all crypto exchanges dropped to a low of 16.61 million ETH on June 30, its lowest level since July 2021.
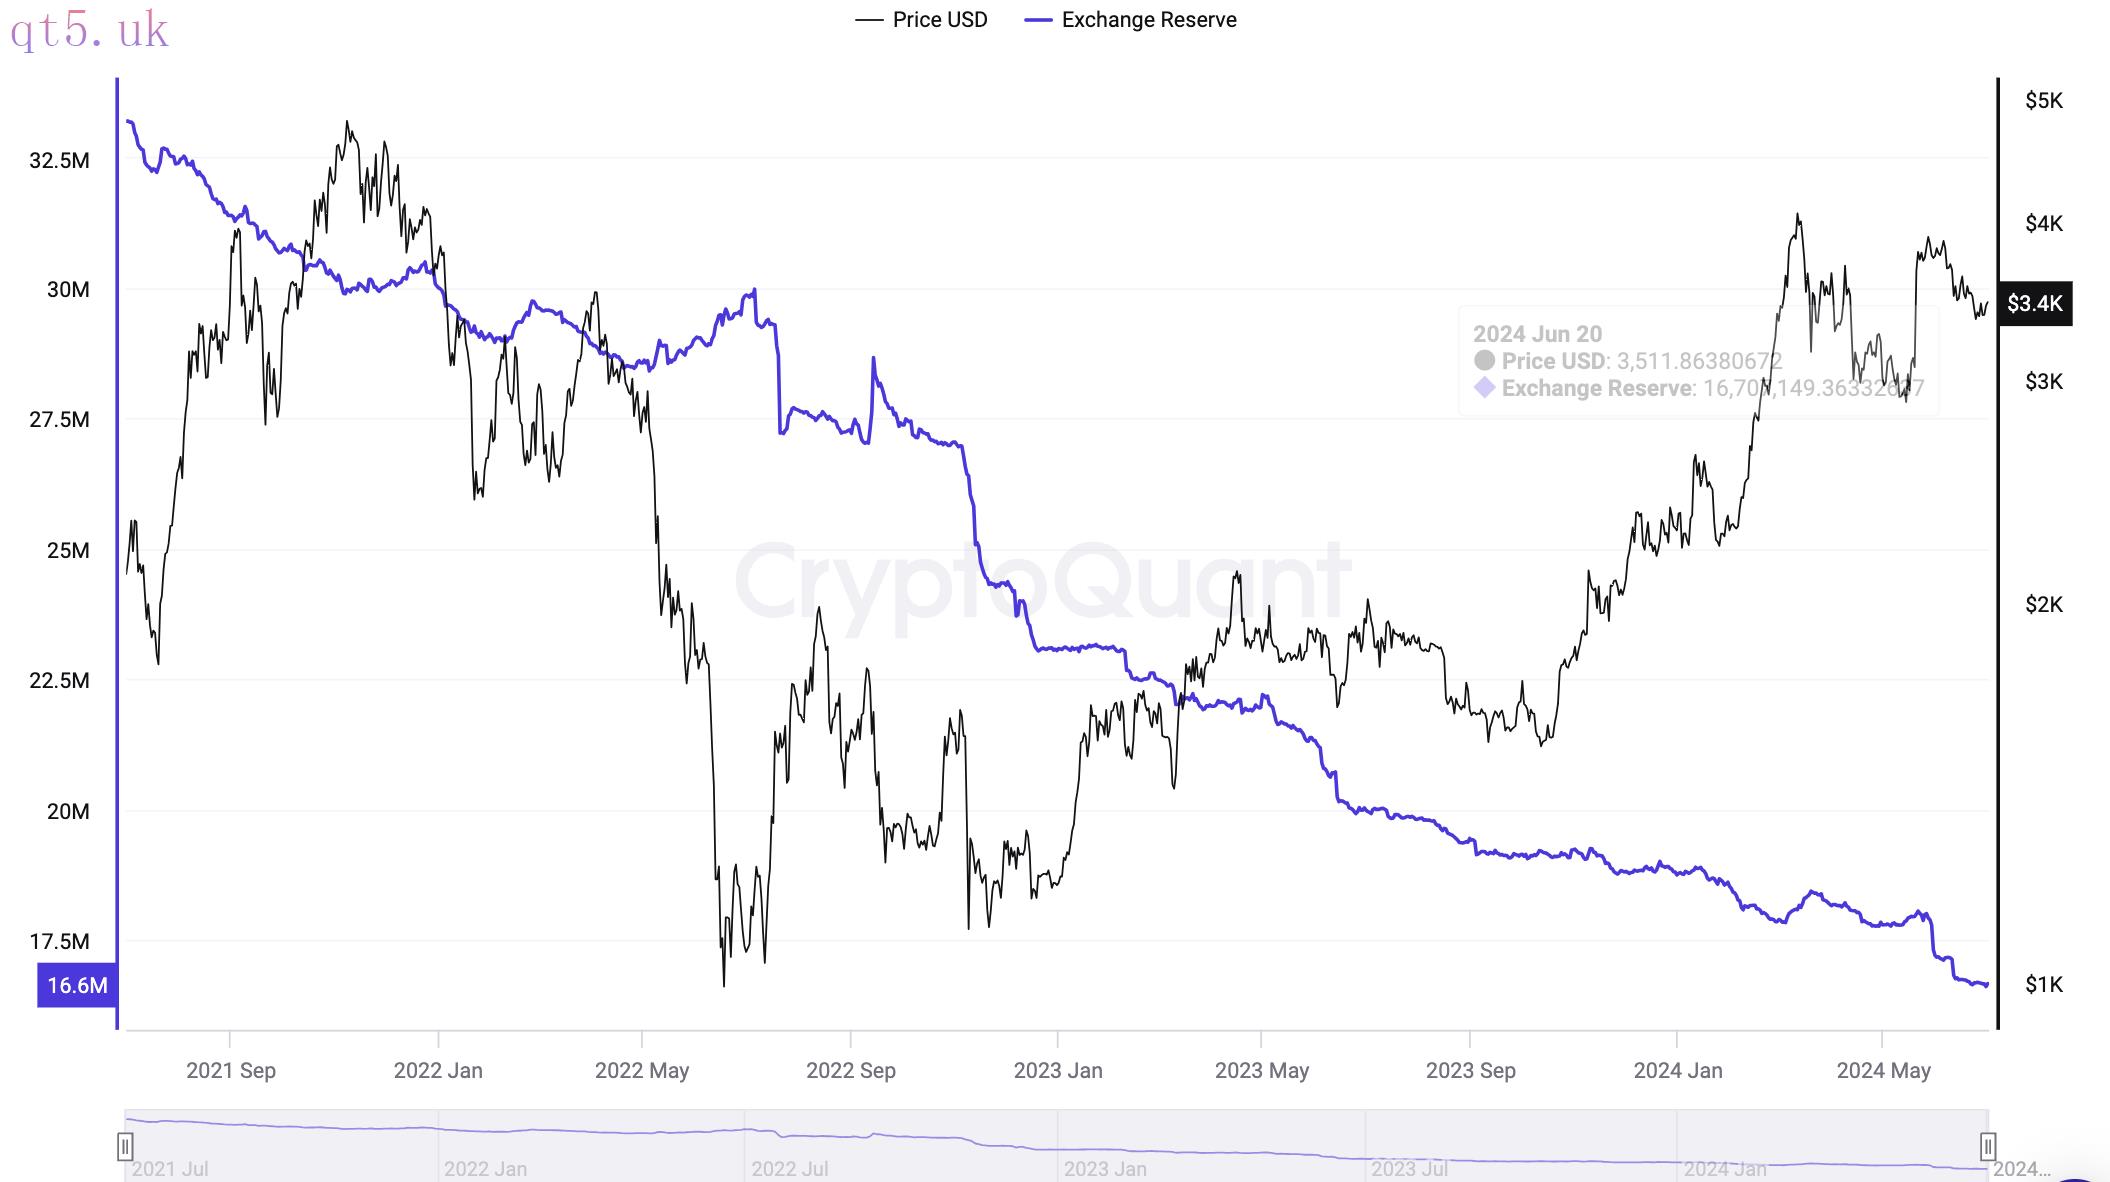 Ethereum reserve on exchanges. Source: CryptoQuant
The surge in Ether outflows from crypto exchanges has aligned with the altcoin’s price increase, indicating reduced selling pressure and a growing preference for holding ETH in private wallets or decentralized protocols.
Additional data from CryptoQuant reveals that the total value of ETH staked on the Ethereum Beacon Chain has risen steadily since September 2021 to 33.33 million ETH as of June 30—nearly twice the amount held by exchanges.
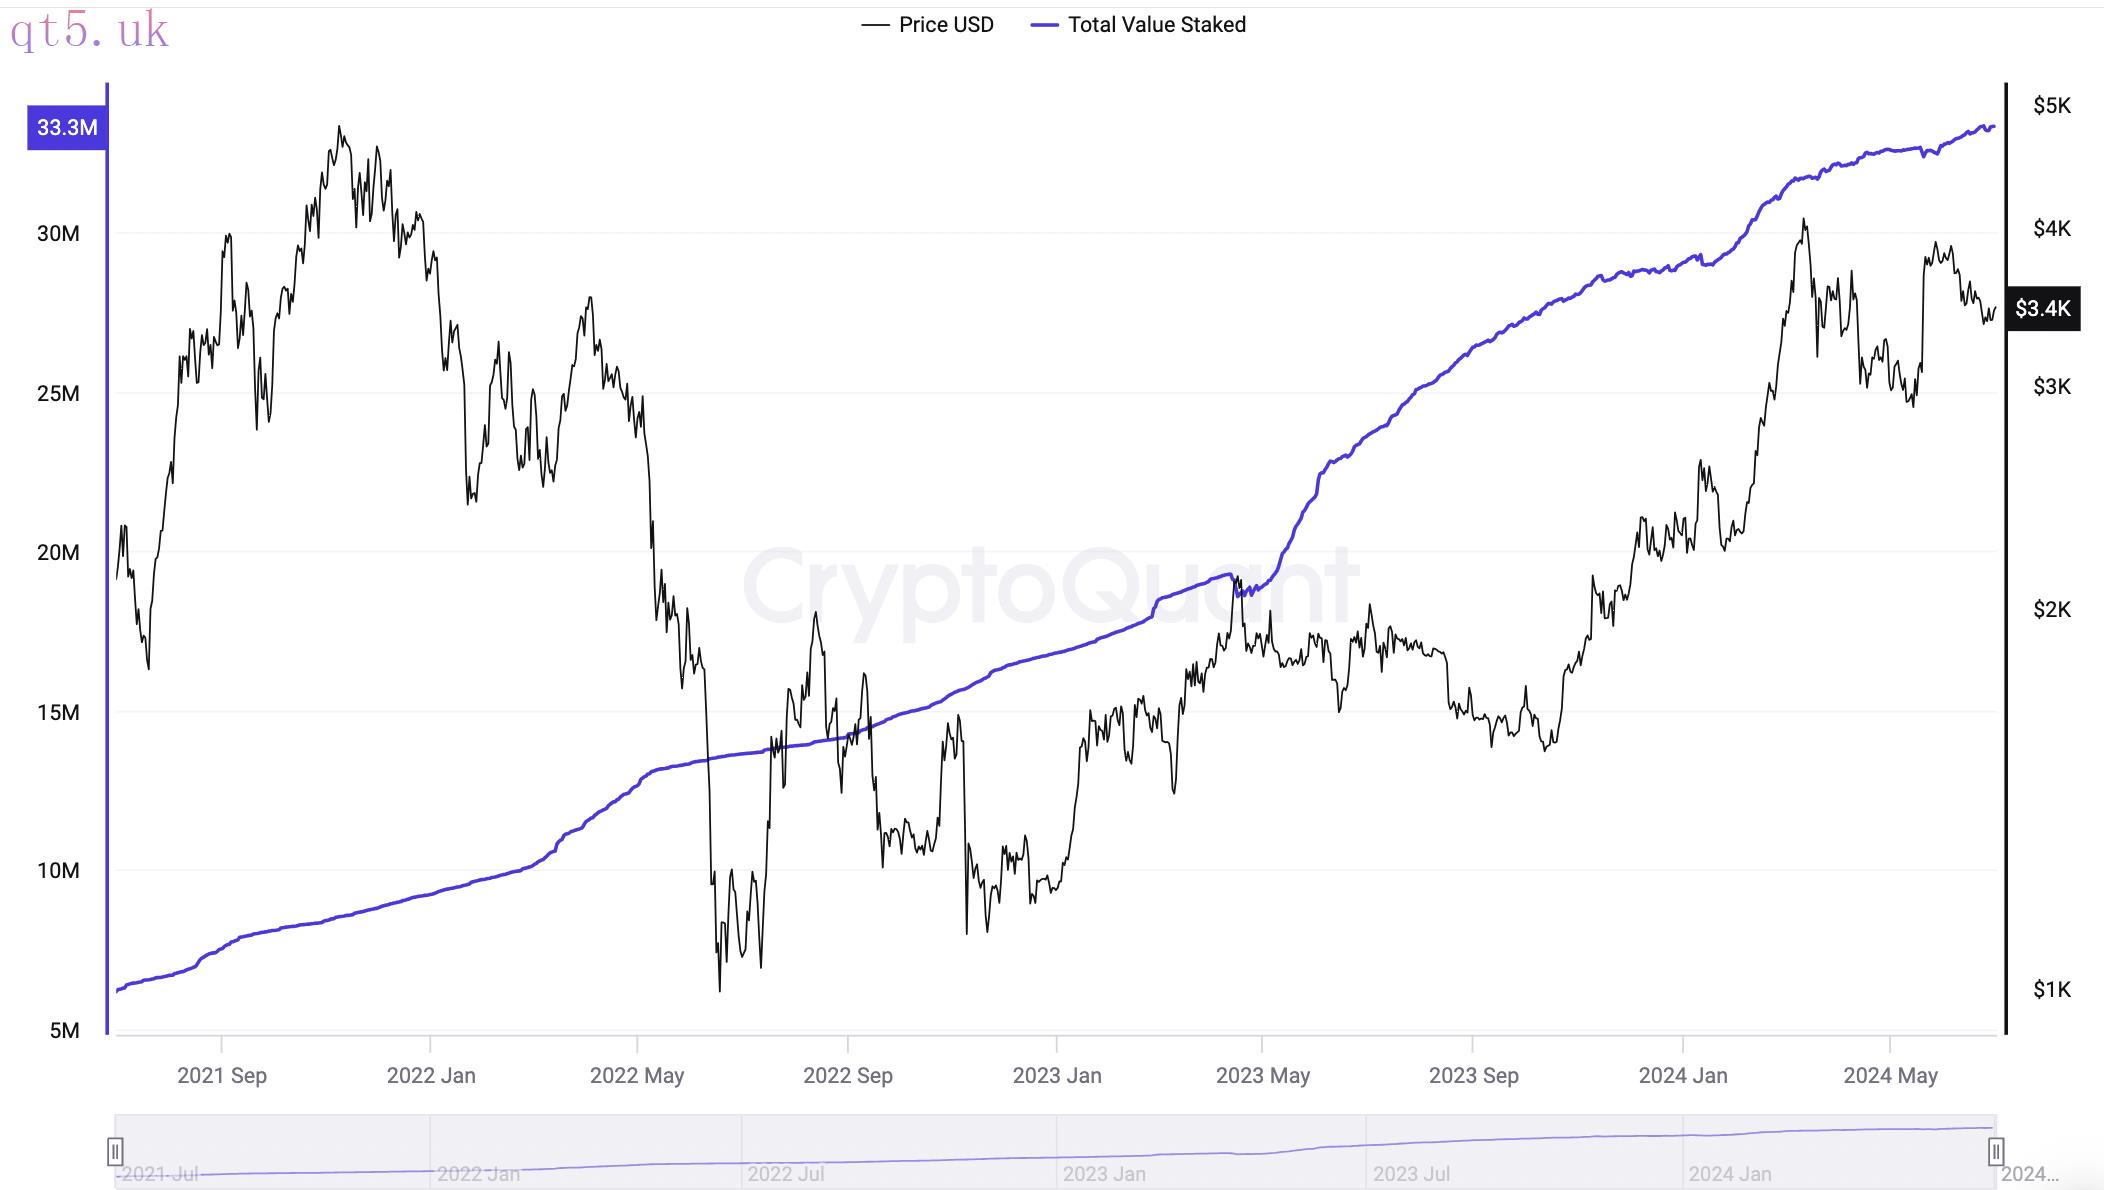 Total value staked (ETH). Source: CryptoQuant
This growth persists despite Ethereum’s Shanghai upgrade in March 2023, which eliminated the requirement for ETH stakers to lock their tokens indefinitely.
Most users haven’t withdrawn their staked ETH despite now having the option, which shows a preference for the benefits of staking, like stability and rewards, over selling.
Related: As Ethereum phishing gets harder, drainers move to TON and Bitcoin
Ether trades above a strong support zone
From a technical perspective, ETH is trading above a strong support zone compared to the resistance it faces in its recovery path. Data from IntoTheBlock shows that the immediate support around $3,400 is within the $3,362 and $3,407 price range, where roughly 3.88 million ETH were previously bought by about 2.83 million addresses
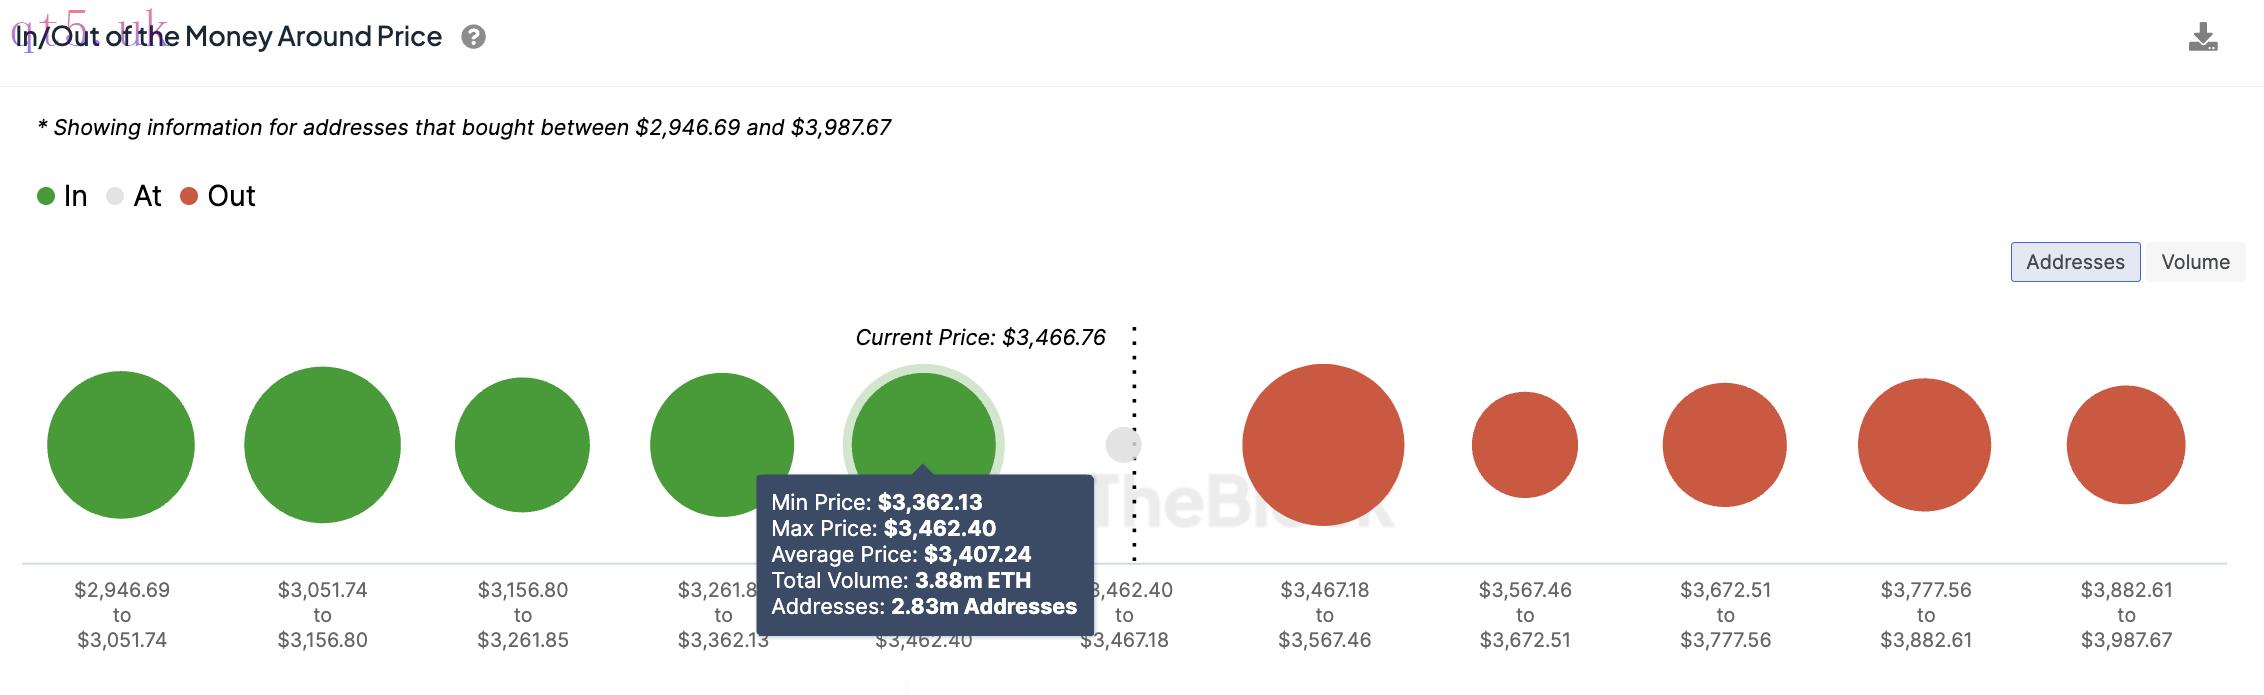 ETH IOMAP Chart. Source: IntoTheBlock
The ETH/USD daily chart below shows that the price has been oscillating around this level since June 24, suggesting that the level is important for buyers and sellers.
If the bulls manage to hold above this level, they could push the price above the 50-day simple moving average (SMA) at $3,536. A key level to watch on the upside is the March 12 range high at $4,093.
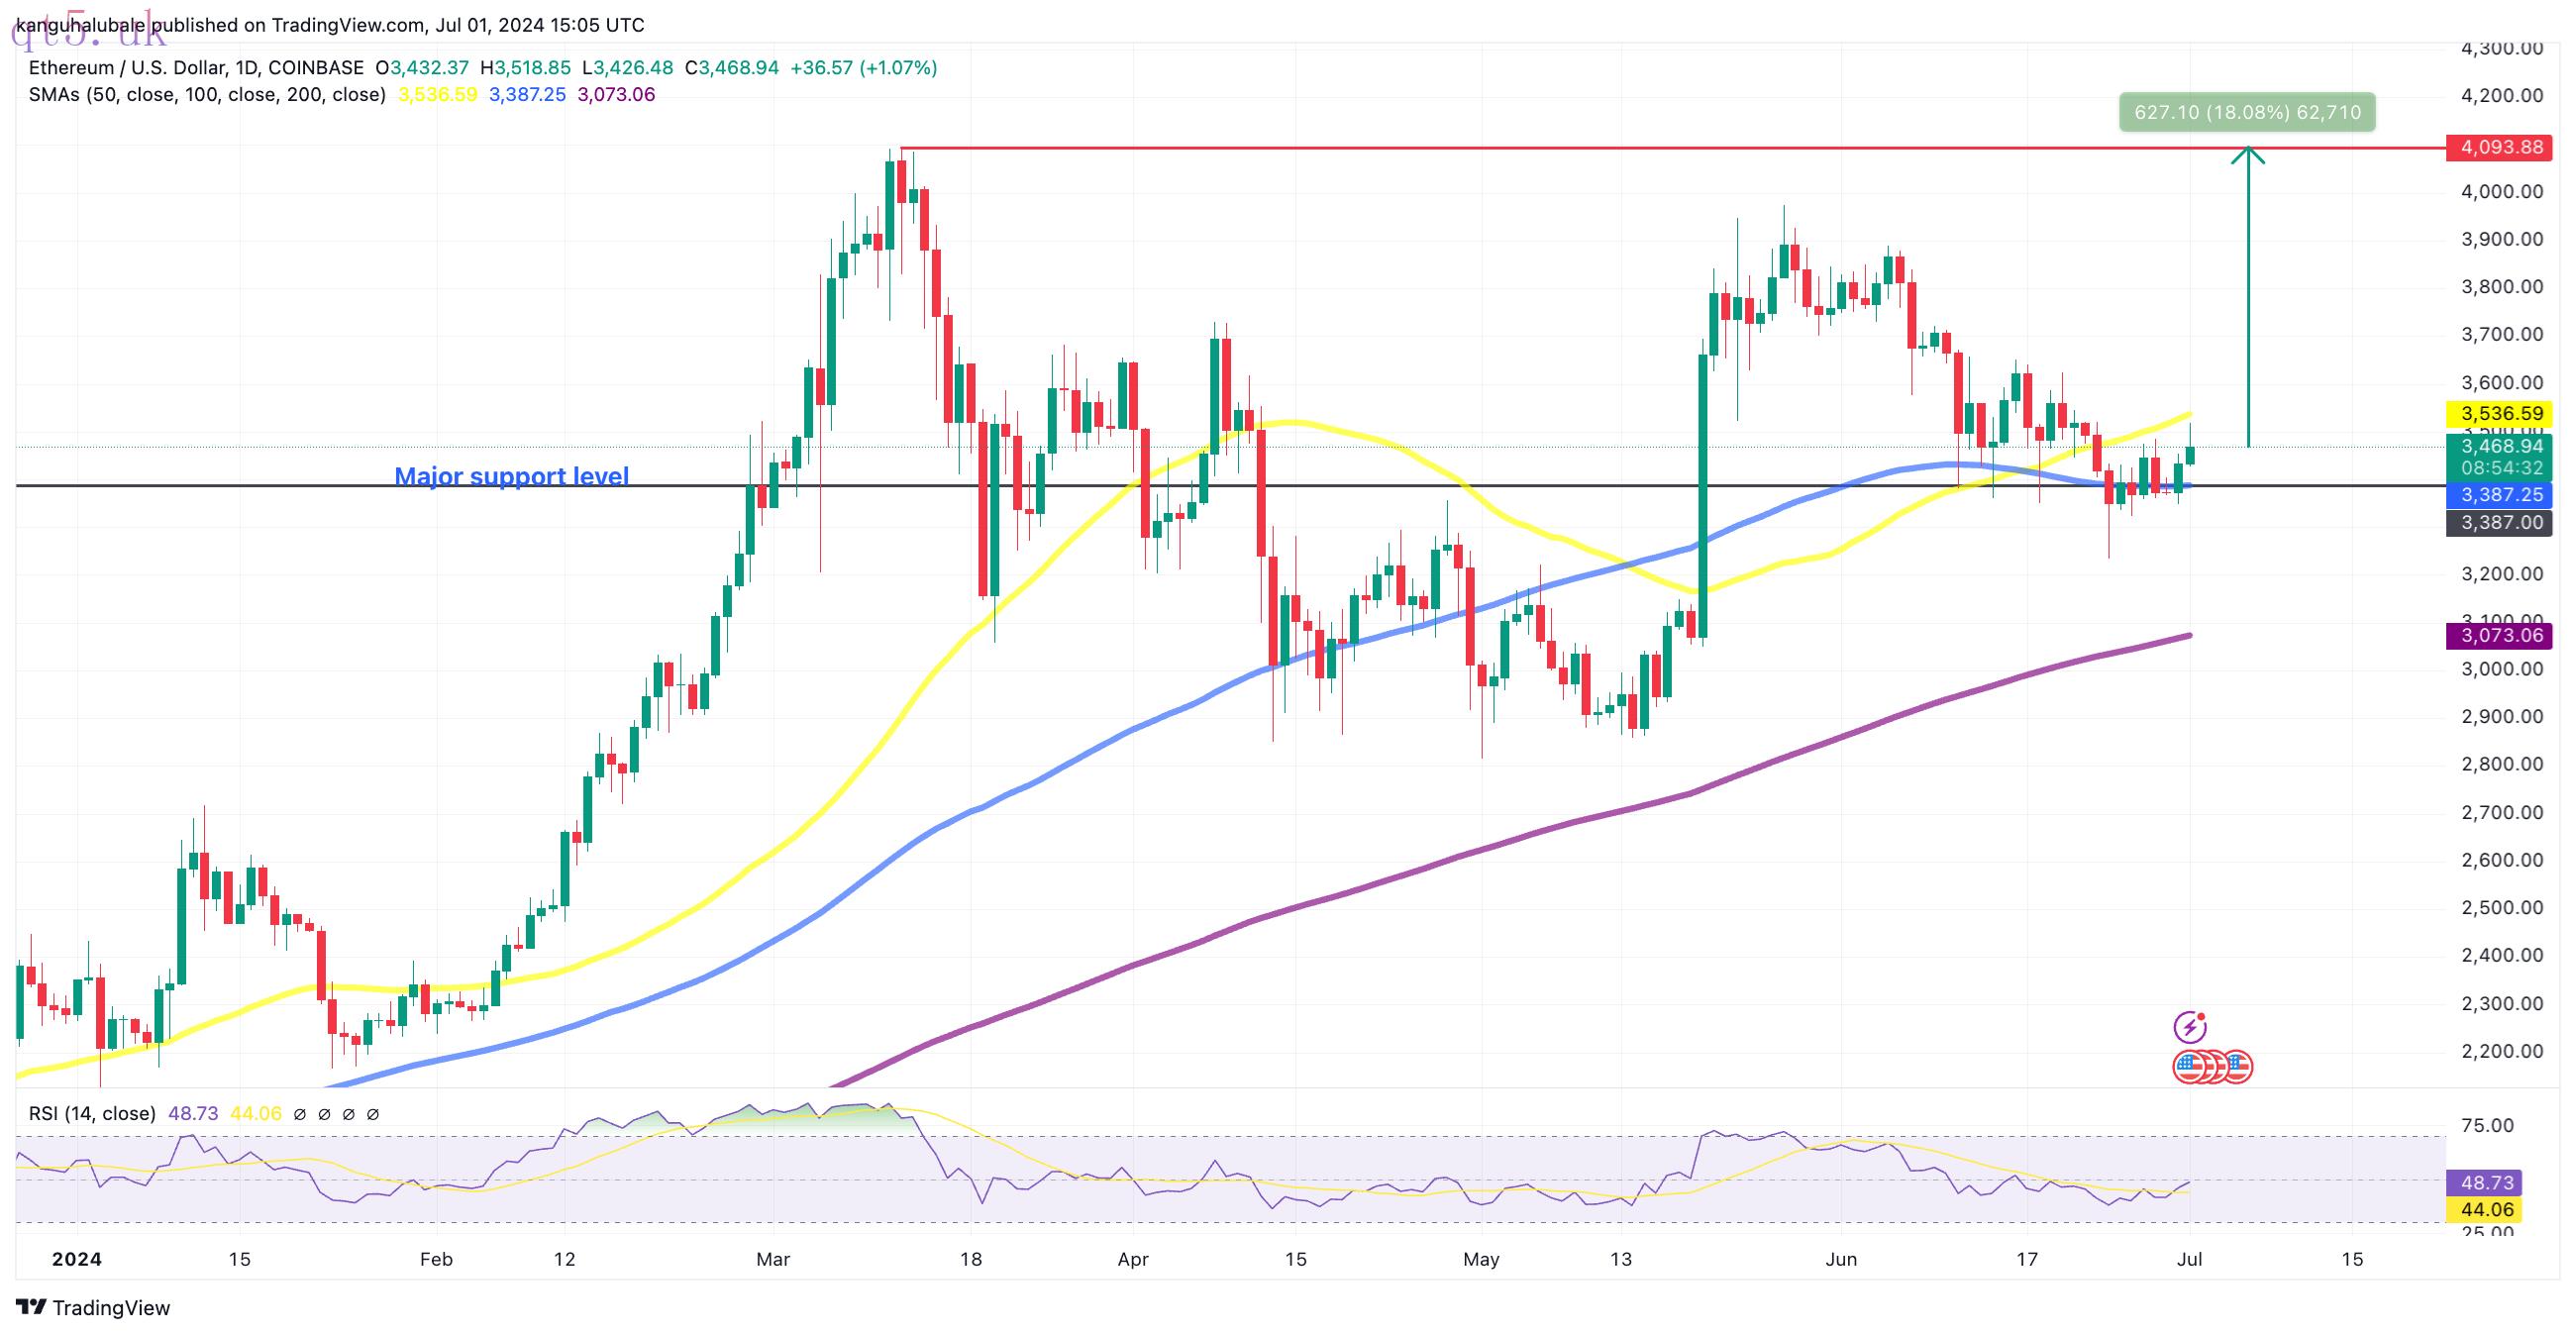 ETH/USD daily chart. Source: TradingView
On the other hand, sellers could pull the price below this level with the 100-day SMA at $3,380, providing the first major support. More defense lines could emerge from the 200-day SMA at $ 3,073 and the $3,000 demand level.
This article does not contain investment advice or recommendations. Every investment and trading move involves risk, and readers should conduct their own research when making a decision.

 download
 download
 website