Bitcoin (BTC) starts Q3 2024 with a pop as bulls aim to regain lost ground on the way to all-time highs.
BTC price strength is tentatively returning as the combined weekly, monthly and quarterly sees $60,000 support remain in place.
Building on 4% gains over the 24 hours to the time of writing, Bitcoin certainly has its work cut out in order to continue its bull market.
Months of consolidation has now resulted in two trips below the $60,000 mark, both of which are now looking increasingly like bear traps. Can bulls really win out?
Going forward, traders will be looking not just at $60,000, but at other important bull market trendlines in order to gain more confidence in the BTC price rebound.
Macroeconomic data will add to the overall volatility odds this week, with plenty of United States unemployment data on the cards in addition to inflation cues from senior Federal Reserve officials.
Attention is also on Bitcoin miners. After several weeks in a hash rate “capitulation,” will the current low hash price keep the industry from bouncing back?
Cointelegraph takes a closer look at these issues and more as BTC/USD recovers from what bulls hope was a fake breakdown as July gets underway.
Bitcoin faces battle for bull market continuation
A series of spikes higher on the last day of June helped Bitcoin secure a promising weekly, monthly and quarterly close above $62,500.
Momentum then continued, with BTC/USD hitting local highs of $63,724 on Bitstamp before consolidating lower, per data from Cointelegraph Markets Pro and TradingView.
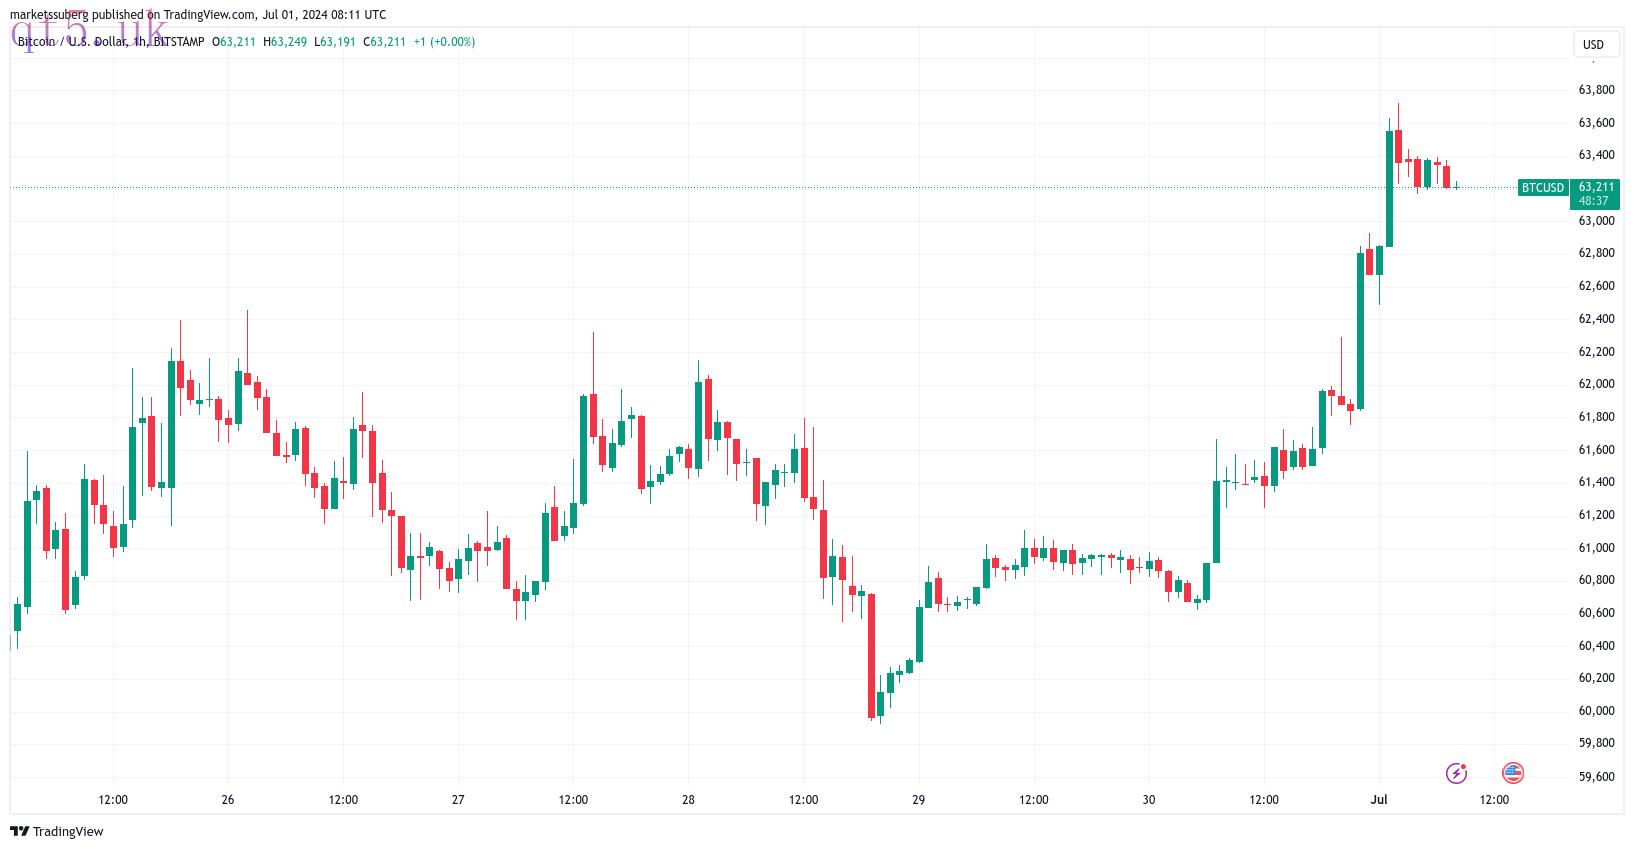 BTC/USD 1-hour chart. Source: TradingView
Figures from monitoring resource CoinGlass confirm 7% losses in June, while Bitcoin finished Q2 down a total of 12%.
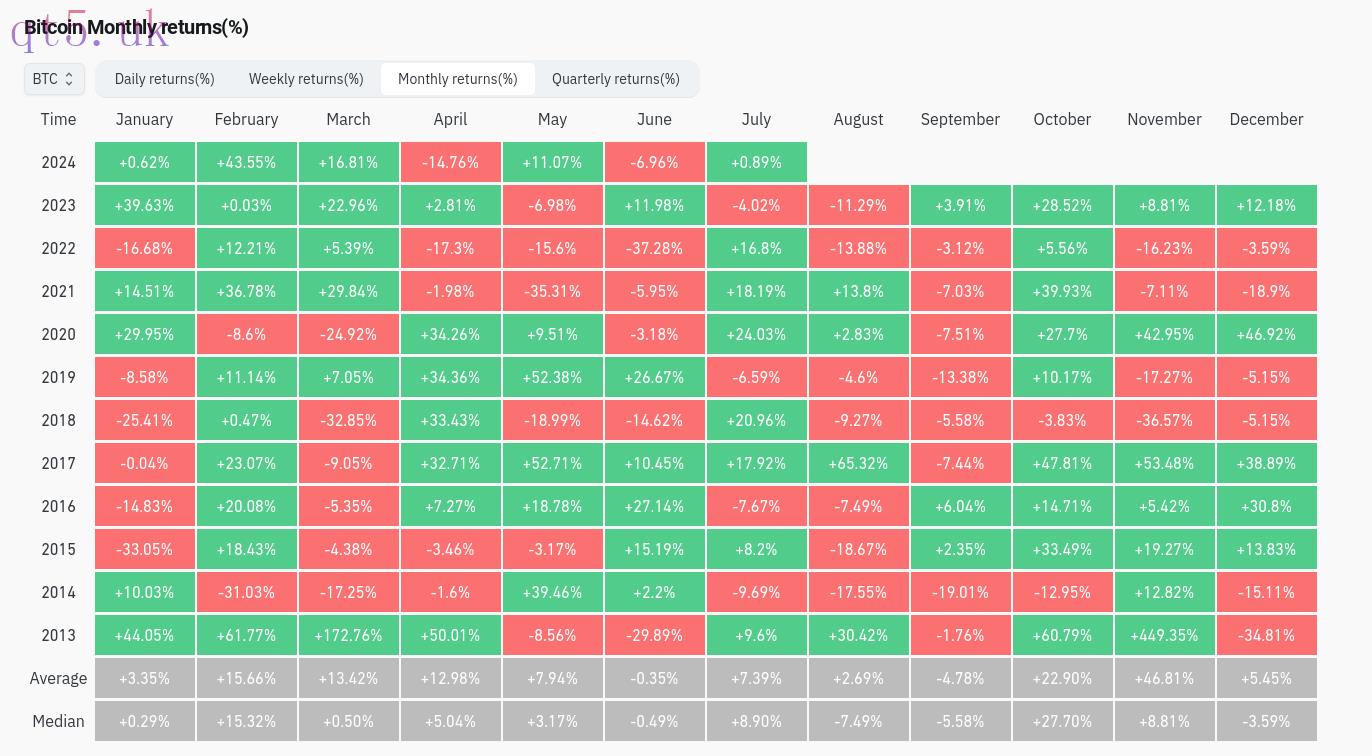 BTC/USD monthly returns (screenshot). Source: CoinGlass
Looking to the immediate future, market participants nonetheless remain cautious, with much ground left to recover for sentiment to improve.
For Keith Alan, co-founder of trading resource Material Indicators, “Bitcoin had a nice rally off of the lows, but at the moment, it doesn't look like Bulls have enough momentum to close above the 21-Week Moving Average.”
“Failure to move above it, could mean another retest of the lows before BTC can return to ATH territory,” he wrote in part of his latest update on X (formerly Twitter).
Alan referred to one important support line recently lost as support. The 21-week moving average currently sits at around $64,000.
“TLDR: Save some dry powder,” he summarized.
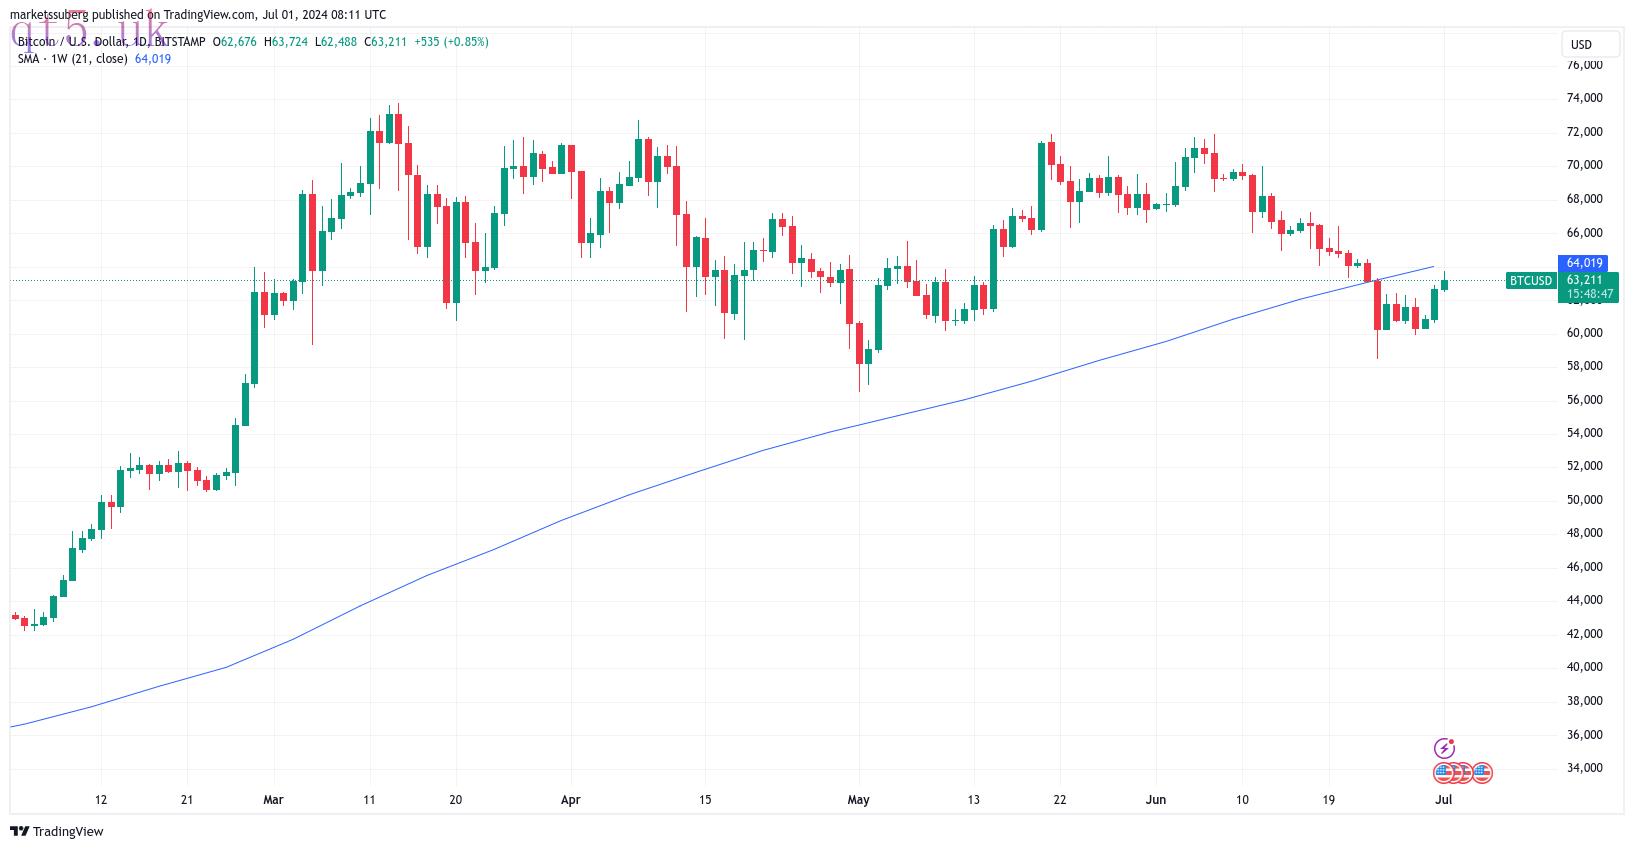 BTC/USD 1-day chart with 21-week MA. Source: TradingView
Popular trader Daan Crypto Trades meanwhile notes the large “gap” in CME Group Bitcoin futures which has opened thanks to the weekend’s upside.
Beginning at $60,400, this now represents the “largest we’ve had in a long time,” he warns.
“1. Yes the gap below can get closed but price is quite far away as we speak so don't value it too much,” he wrote in part of analysis on X.
“2. If the market wants to run away, these weekend moves/gaps are the perfect time to do so. Leaves most sidelined. We've seen gaps like that created before that never got closed or not until months/years later.”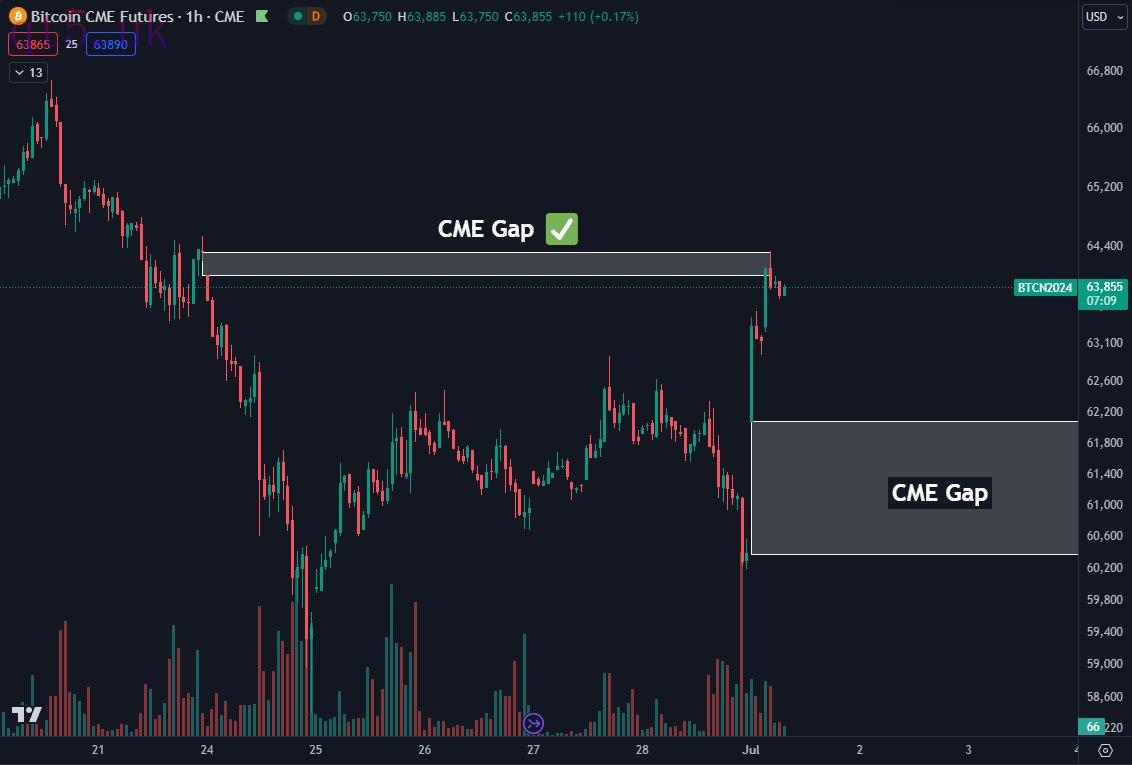 BTC/USD chart with CME futures "gaps." Source: Daan Crypto Trades/X
A look at order book liquidity meanwhile shows price staging multiple liquidity hunts into July, with $64,100 now a key area of interest overhead.
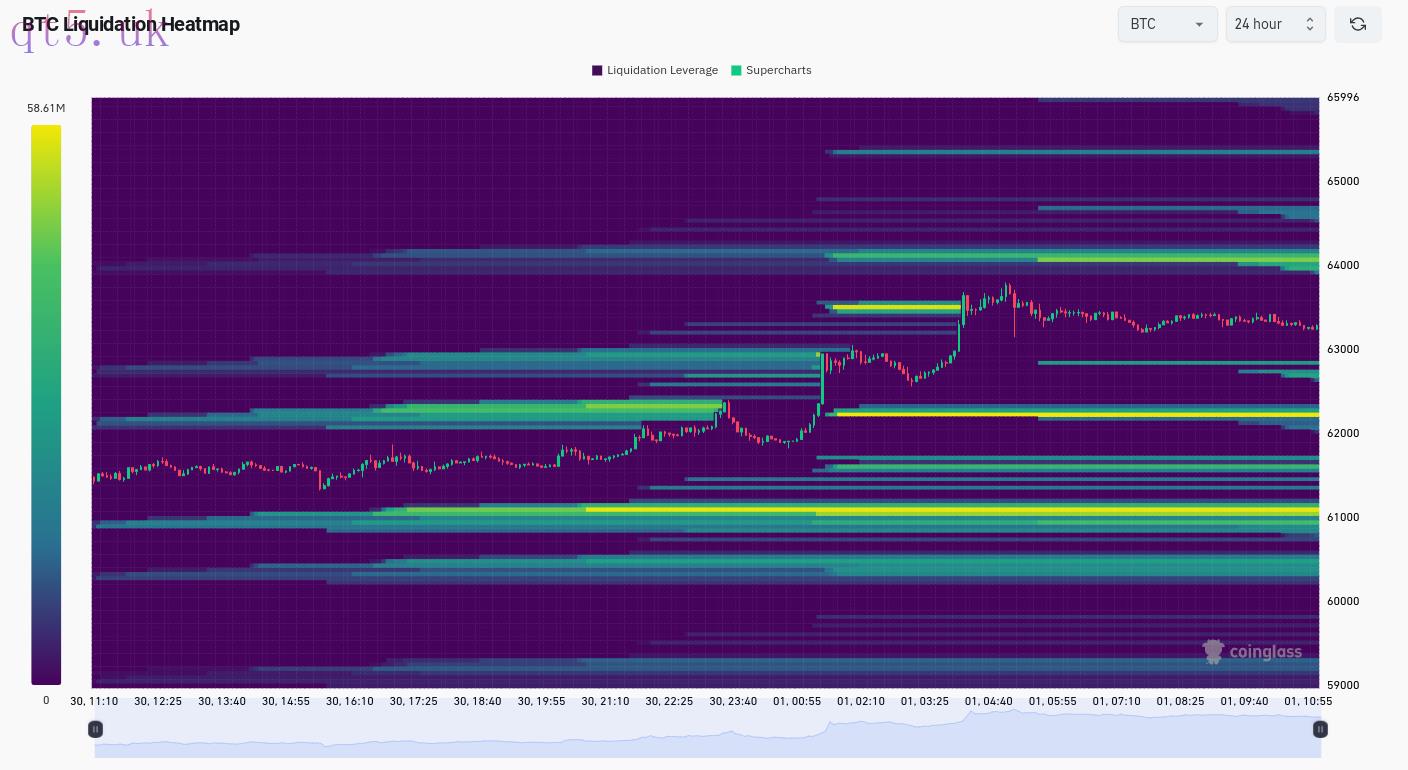 BTC liquidation heatmap (screenshot). Source: CoinGlass
Unemployment data meets Fed's Powell
Several U.S. unemployment data releases form a key element of the week’s macro volatility catalysts.
Despite containing the July 4 holiday, there is no shortage of events which are apt to trigger surprise crypto market moves in the coming week.
In addition to unemployment — a sensitive topic for Bitcoin and altcoins this year — Fed Chair Jerome Powell will speak from a monetary policy forum in Sintra, Portugal on July 2.
A day later, the minutes of the Fed’s previous meeting on inflation policy matters will be released.
“We have a short but very busy week ahead,” trading resource The Kobeissi Letter summarized about the upcoming diary dates.
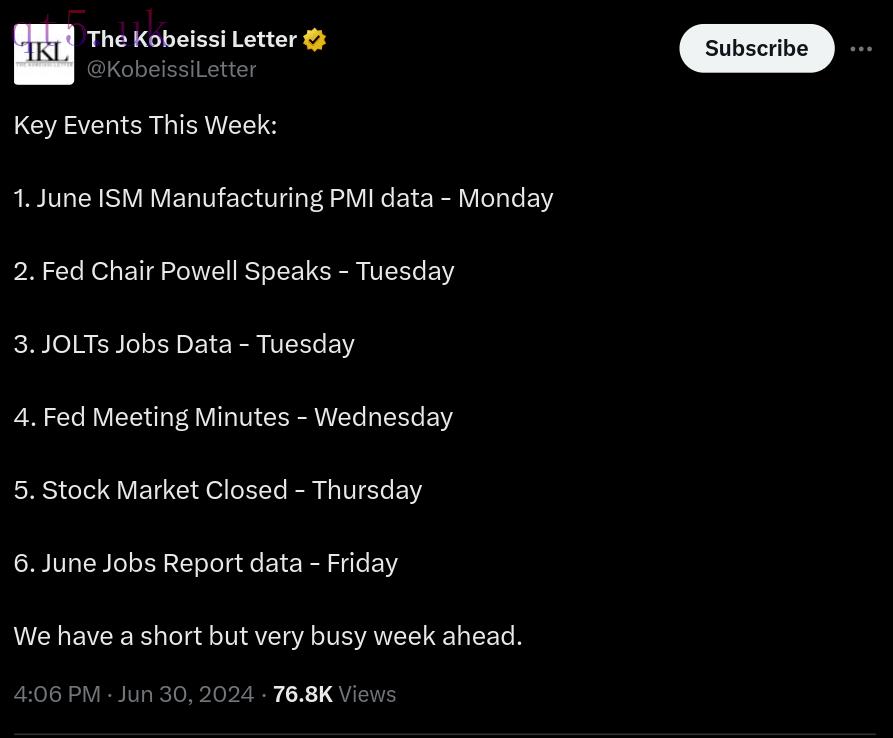 Source: The Kobeissi Letter
Looking forward, trading desk QCP Capital is increasingly optimistic about the broader risk-asset climate this month.
“Looking at seasonality, BTC has a median return of 9.6% in July and tends to bounce back strongly especially after a negative June (-9.85%),” it wrote in part of its latest bulletin to Telegram channel subscribers.
“Our options desk also saw flows positioning for an upside move last Friday into the month-end, possibly in anticipation of the ETH spot ETF launch. Many signs point to a bullish July.”Key BTC price trendline stands out
So far, Bitcoin lacks the impetus to conquer nearby resistance at the key $64,000 level.
The significance of the zone at which BTC/USD has so far rejected after the monthly open is down to several trendlines merging together in a single place.
As Cointelegraph reported, in addition to the 21-week moving average, $64,000 is the site of the Bitcoin short-term holder (STH) cost basis. Also known as realized price, it reflects the aggregate buy price of coins acquired by speculators.
Throughout the current bull market, the cost basis has acted as support, with the only exception coming in August 2023.
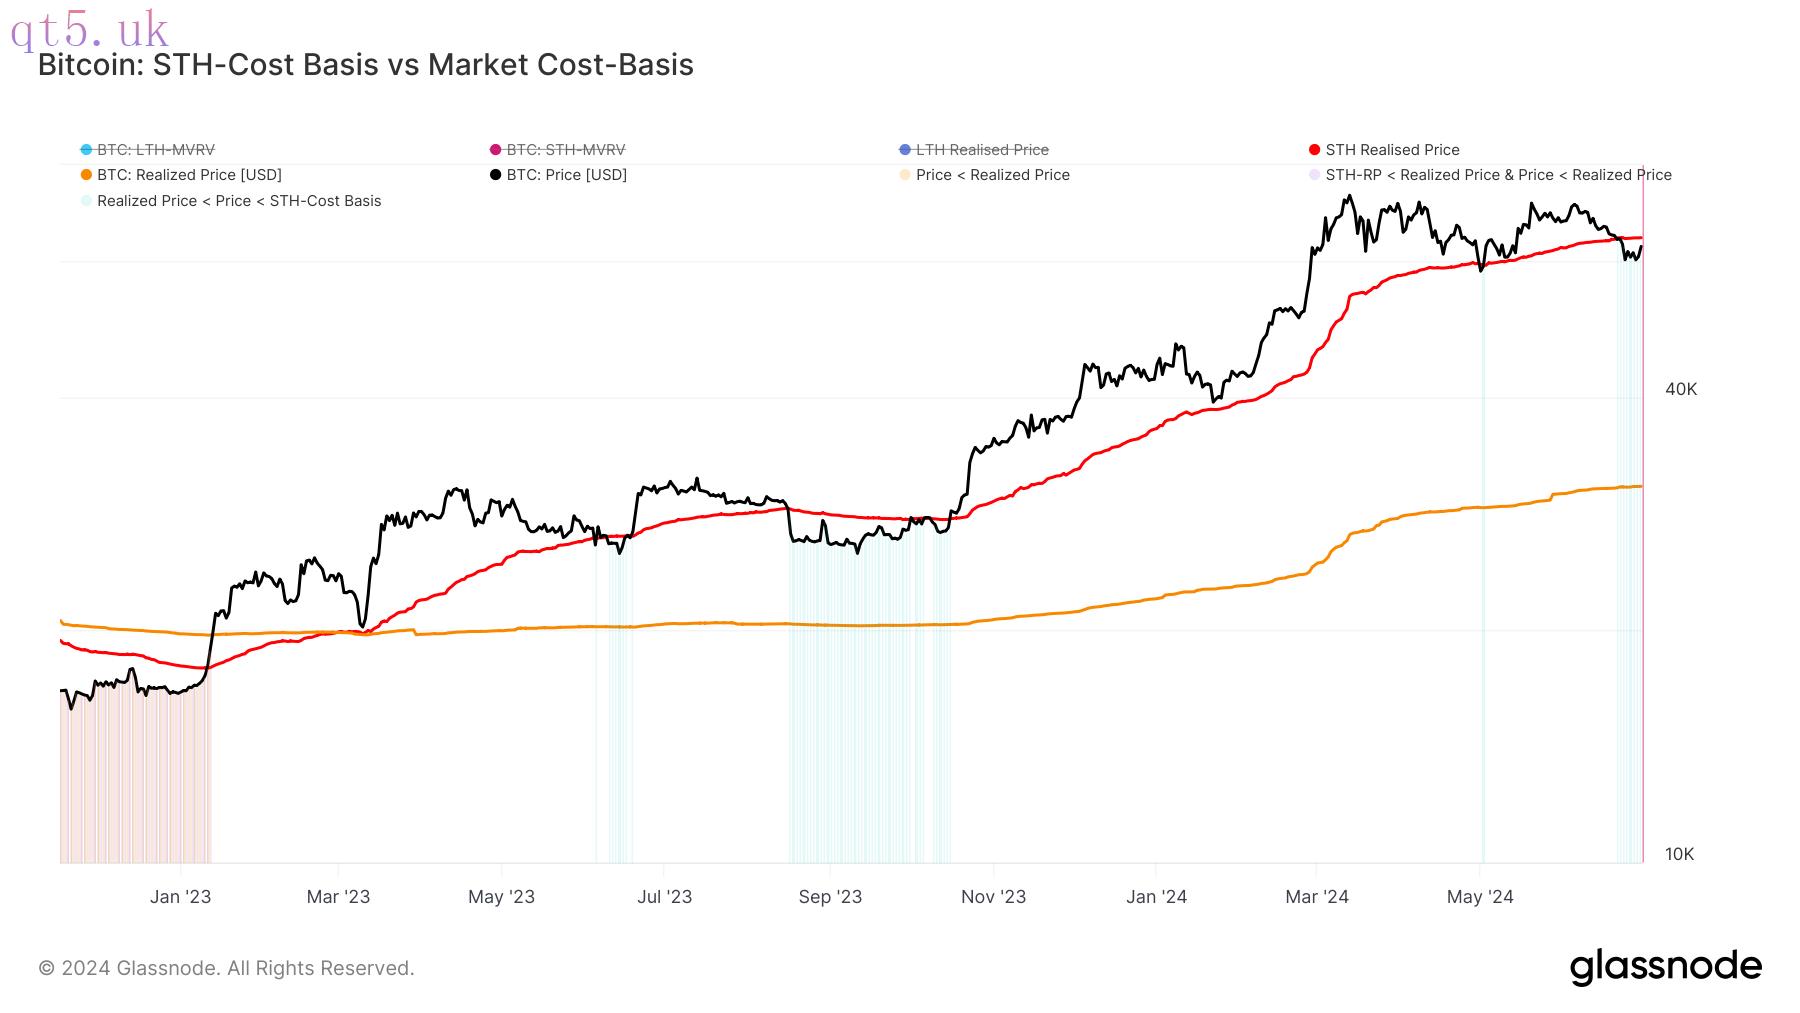 Bitcoin cost basis data. Source: Glassnode
“If the price does not move above the sth price quickly, it will likely turn into a resistance level for the price going forward,” SignalQuant, a contributor to on-chain analytics platform CryptoQuant, warned in one of its Quicktake blog posts last week.
At current prices, STH entities, which correspond to those hodling a given amount of BTC for 155 days or less, are on average modestly underwater.
The Market Value to Realized Value (MVRV) metric, which compares STH holdings to purchase price, is thus below the breakeven point of 1. With the exception of early May, this is the first such trip into loss-making territory since October 2023, data from on-chain analytics firm Glassnode confirms.
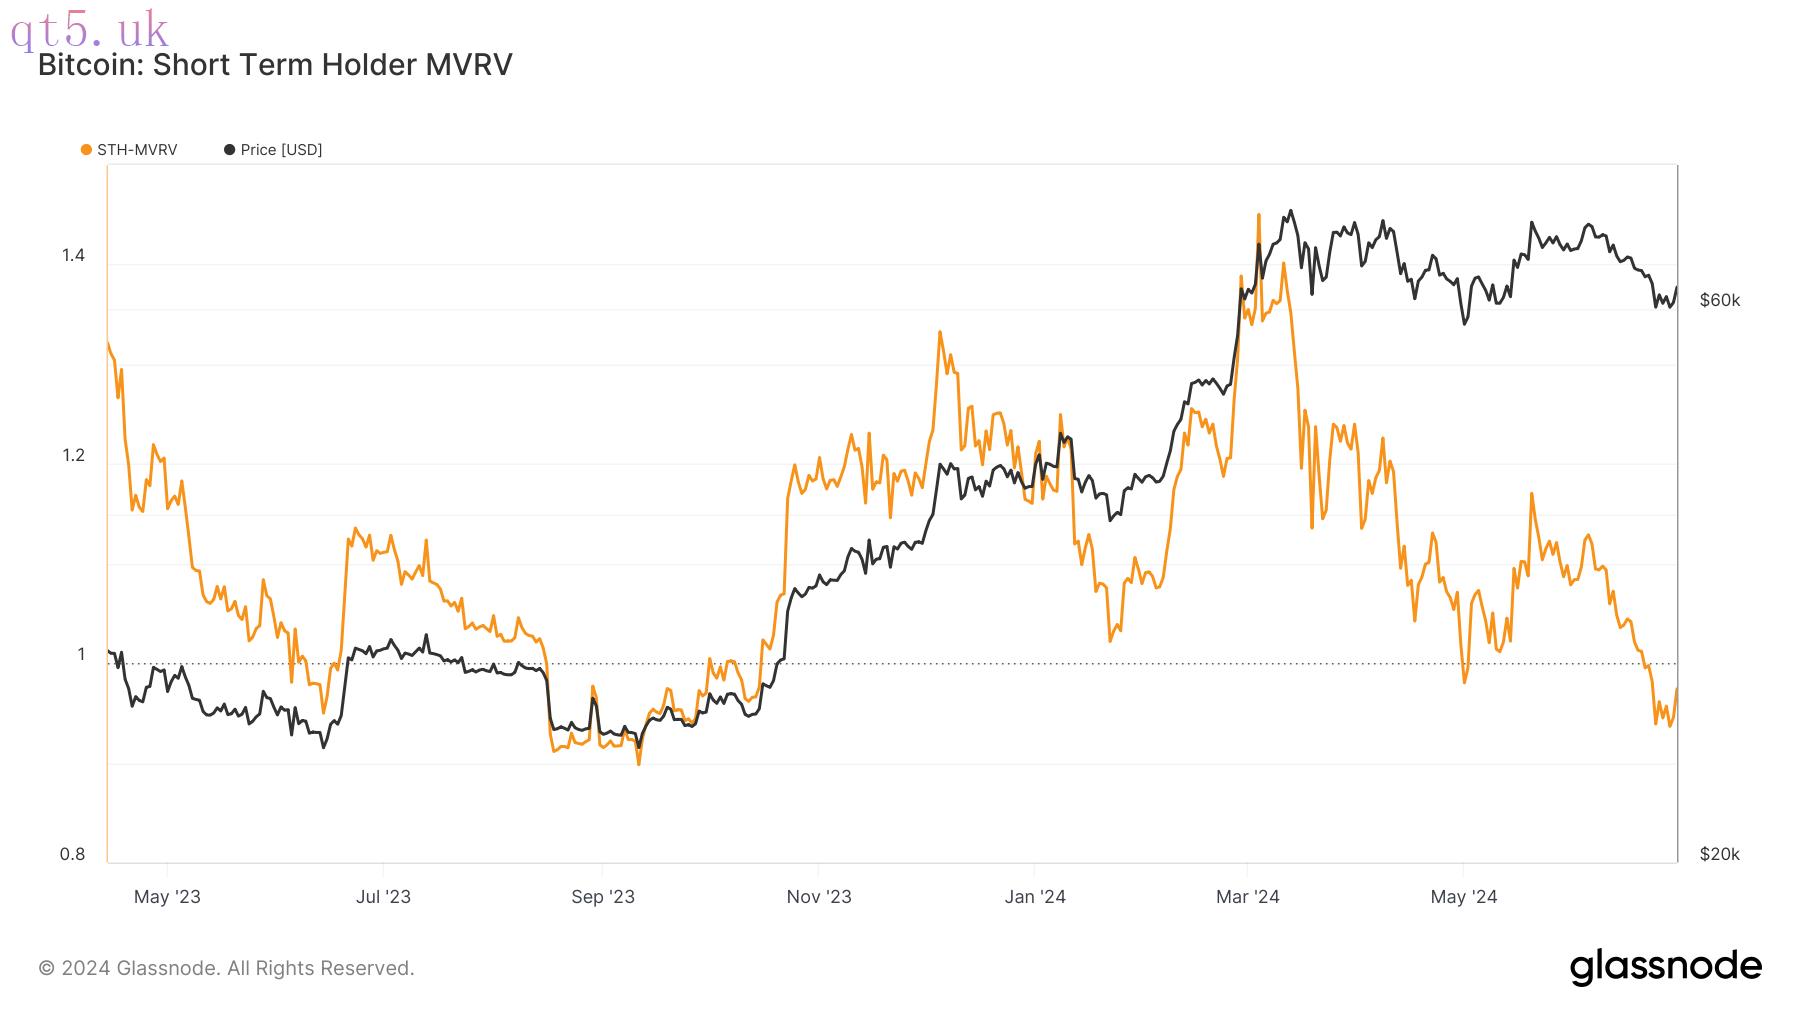 Bitcoin STH-MVRV. Source: Glassnode
Light at the end of the tunnel for miners?
Despite the moderate BTC price rebound, network fundamentals remain in a state of what some describe as “capitulation.”
Difficulty is still forecast to drop by 5% this week, per estimates from monitoring resource BTC.com, and Bitcoin miners continue to adjust to the new economic reality post-halving.
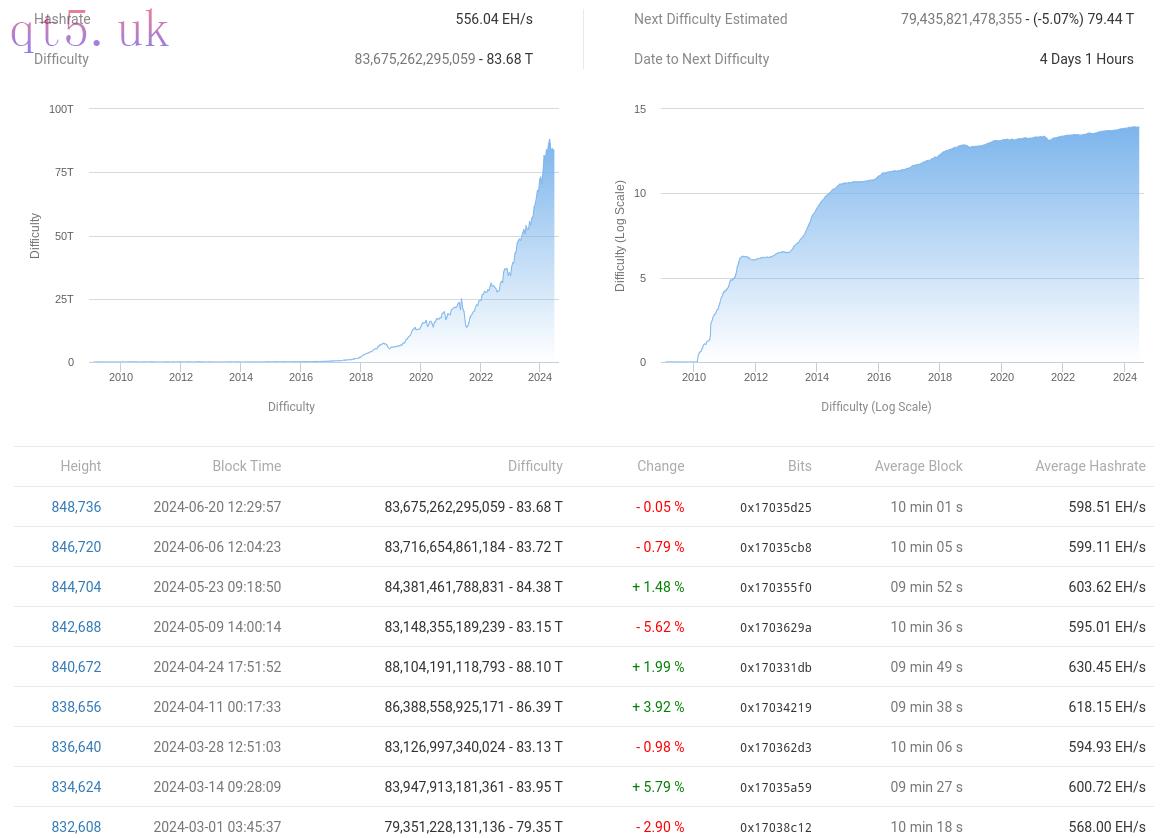 Bitcoin network fundamentals overview (screenshot). Source: BTC.com
As Cointelegraph reported, less efficient miners are likely shutting off due to costs, leading to a drop in hash rate — a familiar phenomenon after a halving event.
The Hash Ribbons metric, which compares 30-day and 60-day hash rate, shows a “capitulation” phase among miners still in situ.
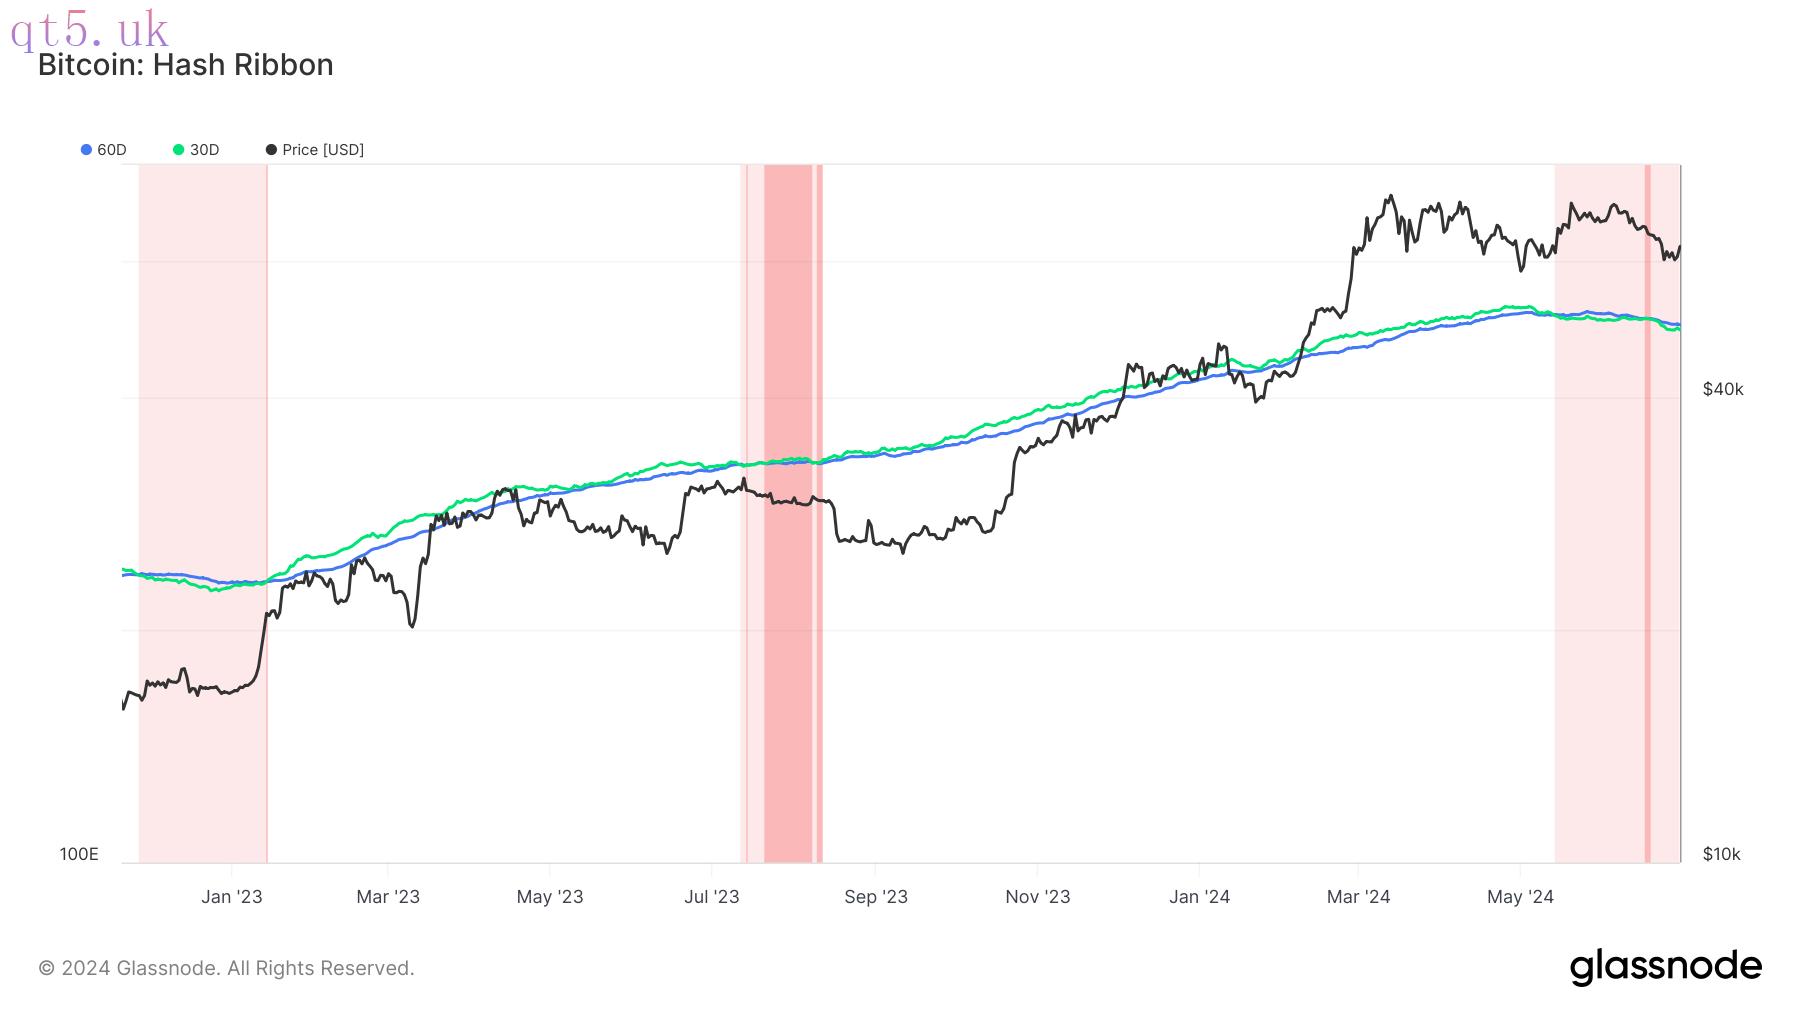 Bitcoin Hash Ribbons. Source: Glassnode
That said, withdrawals from miner-affiliated wallets, miner coins sent to exchanges and OTC transactions have all decreased sharply over the past month, leading to renewed optimism over profitability conditions.
“Miners' selling pressure has decreased significantly and their selling volume is being digested quickly,” CryptoQuant contributor Crypto Dan commented in a recent Quicktake post on the issue.
“Sufficient conditions have been created to continue the upward rally again in the third quarter of 2024.”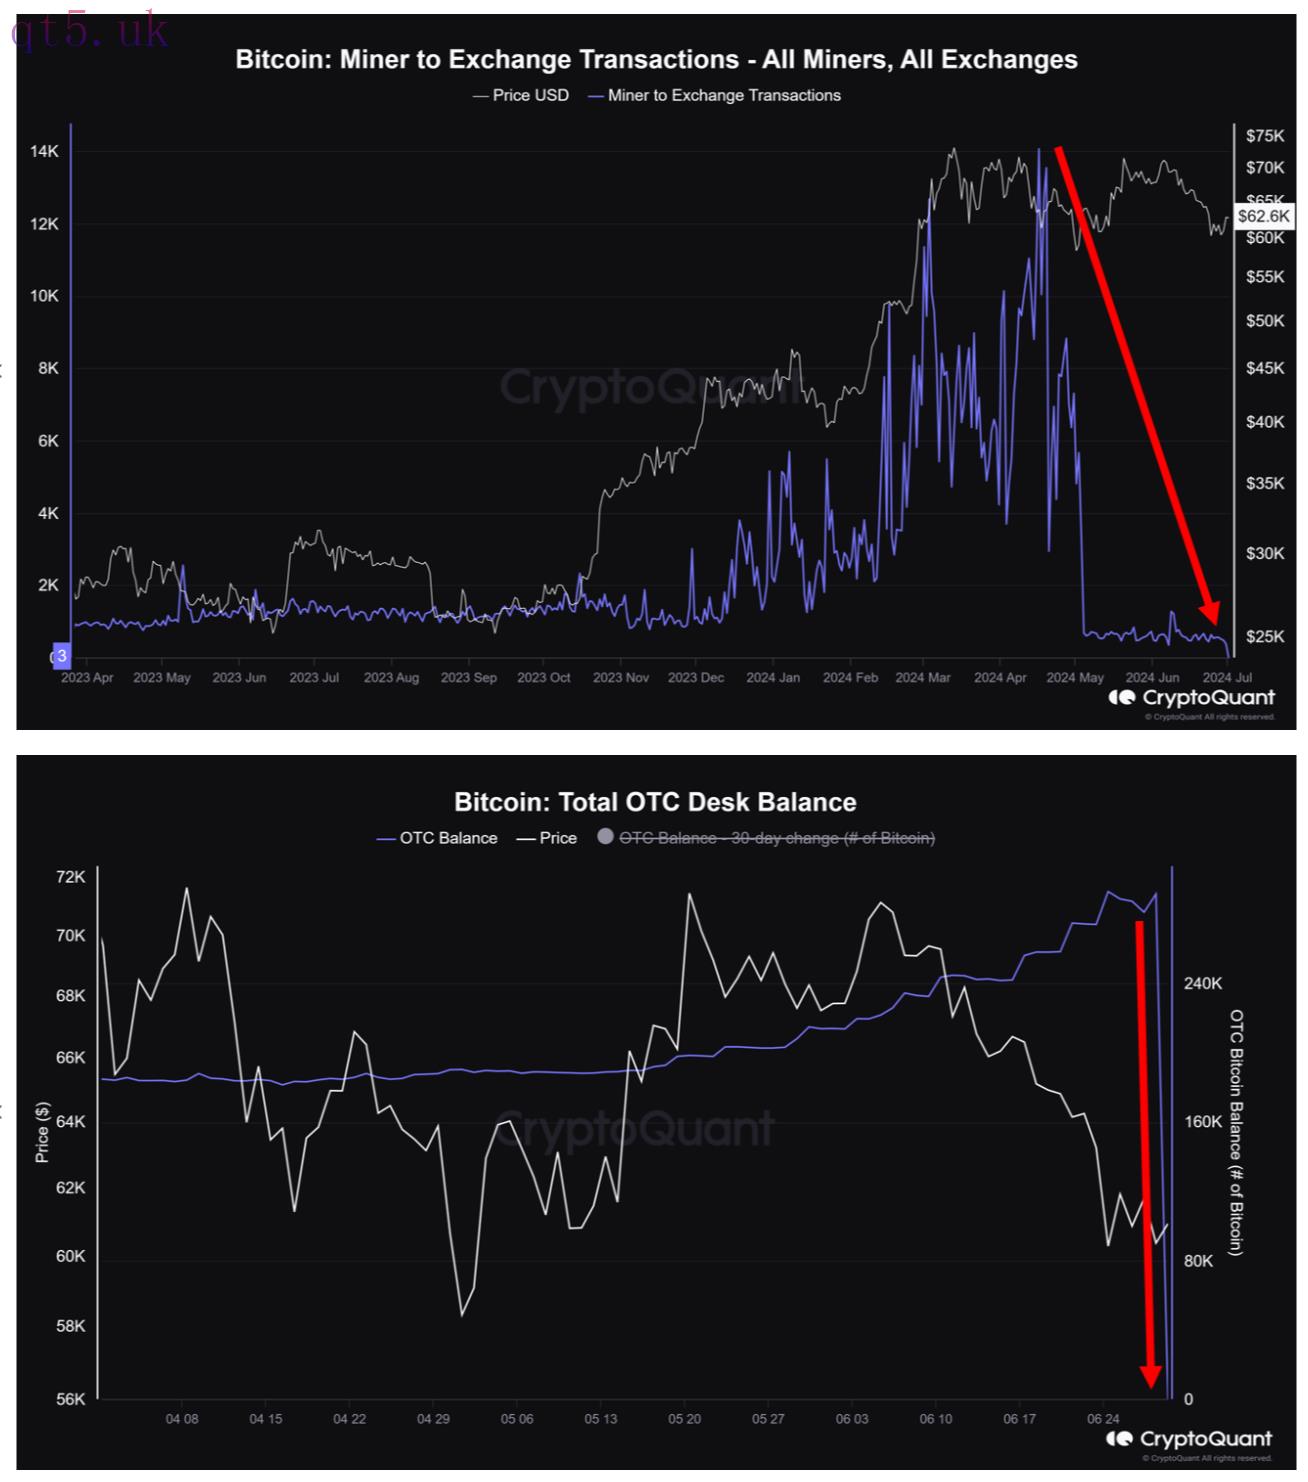 Bitcoin miner transactions to exchanges, OTC desk balance (screenshots). Source: CryptoQuant
Crypto market sentiment sees pronounced recovery
The quarterly close is already making itself felt when it comes to overall crypto market sentiment.
Related: 3 things that can spoil a potentially bullish July for Bitcoin
The latest readings from the Crypto Fear & Greed Index show marked upticks toward “greed” already taking hold over the weekend.
Fear & Greed increased six points into July 1, and as a lagging indicator, the full impact of the latest gains in the combined crypto market cap is likely not yet visible.
By comparison, on June 29, the Index measured just 30/100 — a value not only corresponding to “fear” but knocking on the door of “extreme fear” as the average sentiment score.
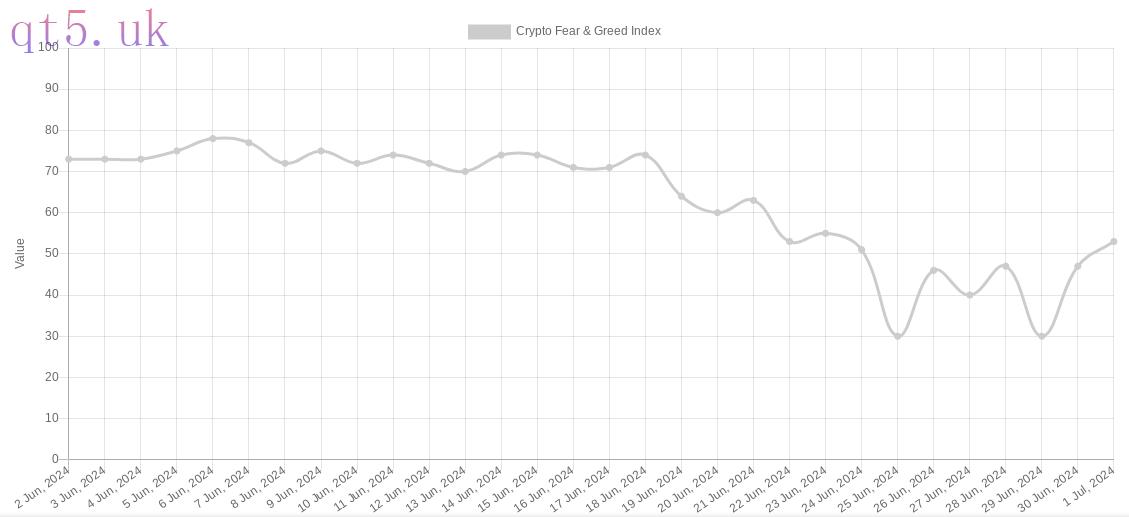 Crypto Fear & Greed Index (screenshot). Source: Alternative.me
During the lows, research firm Santiment nonetheless noted “oversold” readings on Bitcoin’s Relative Strength Index (RSI) as a potential advance signal for a recovery.
“Bitcoin's mild rebound after the dip the past 2 weeks has been short-lived for now. But note the continued negative sentiment pouring in from the crowd, indicating their patience is wearing thin,” it told X followers.
“This, along with a low RSI of just 36, are strong indications a bounce is close.”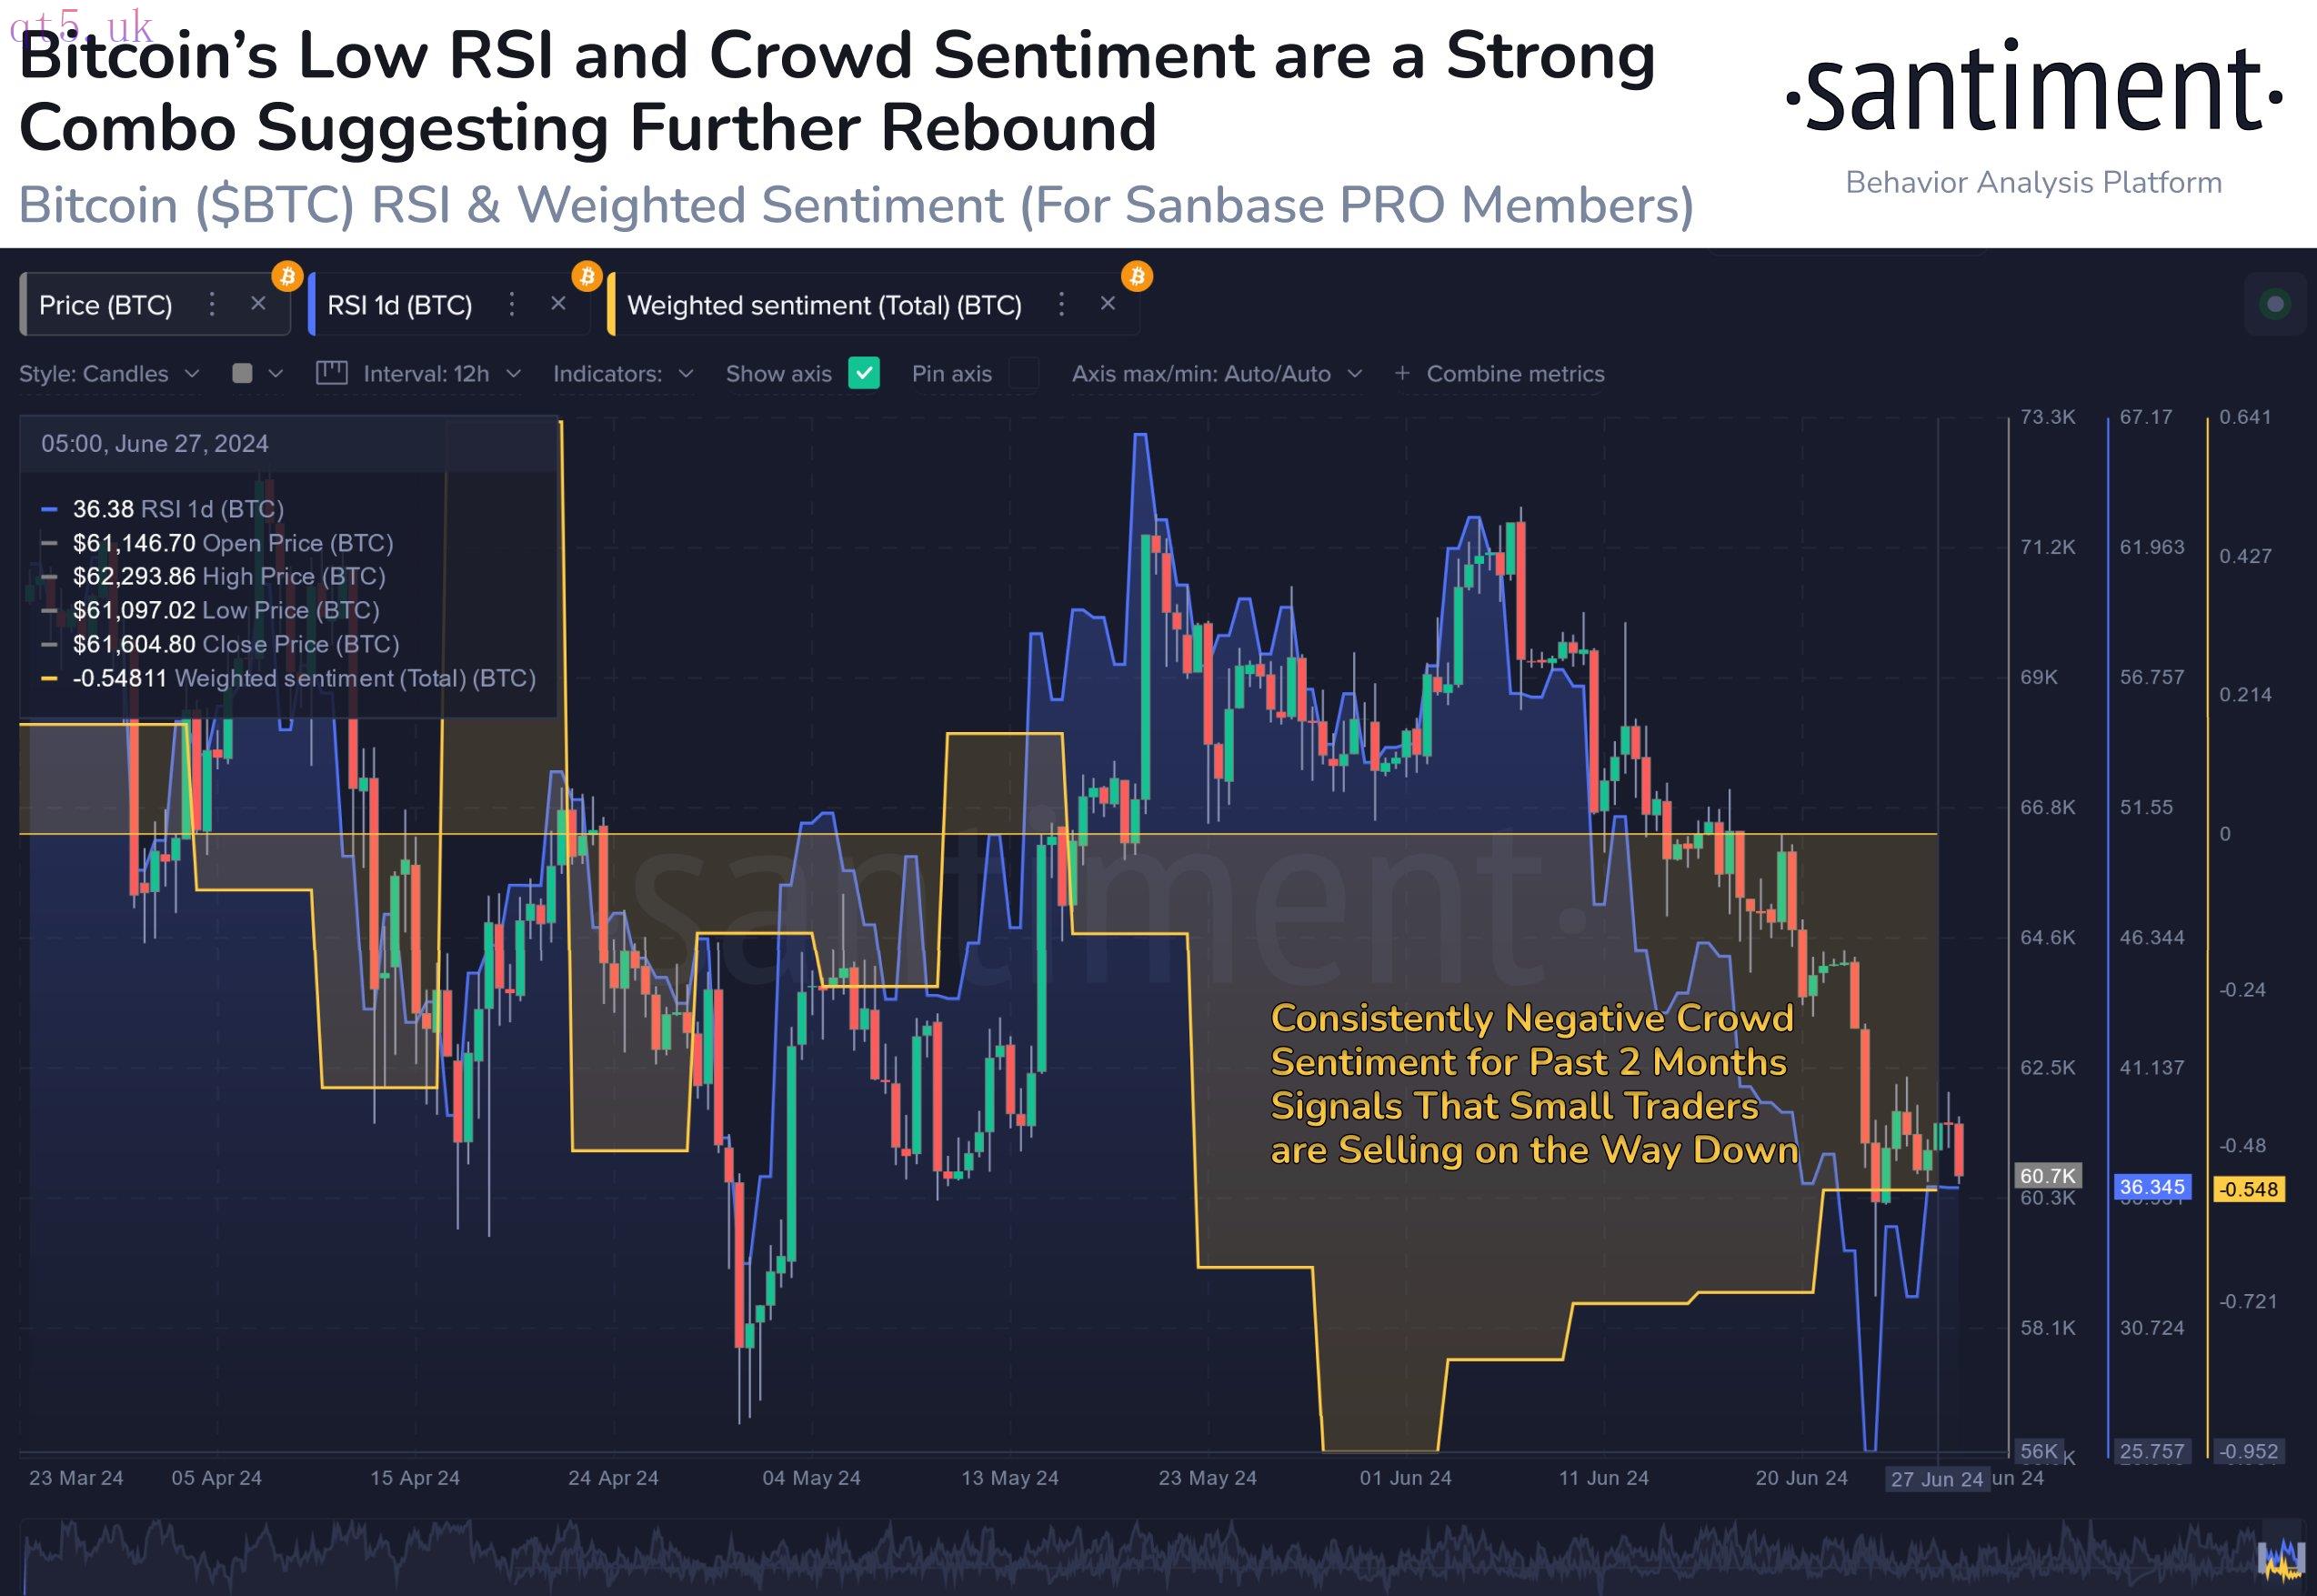 BTC/USD chart with RSI, sentiment data. Source: Santiment/X
This article does not contain investment advice or recommendations. Every investment and trading move involves risk, and readers should conduct their own research when making a decision.


 download
 download
 website